Showing posts with label Technical Indicator. Show all posts

Monday, January 1, 2024

2023 Stock Market Performance Wrap Up

2023 was a great year for the stock market. We finally saw some improvements after the long sideways performance of 2022. 

  • S&P - up 26%
  • Dow - up 13%
  • NASDAG - up 53%

We appear to be in Stage 2 going into 2024 which is a positive sign. A review of Stage 2. This is a time to invest.

  • Stage 2 - Advancing Phase
    • 30 week moving average slopes up. 
    • Close is above the 30 week Moving Average, with higher lows
    • Fundamentals improve


Slickcharts has some fantastic charts. Here is one showing returns year over year for the S&P.


Saturday, October 7, 2023

Stock Market Update - 1st Week in October

While Friday ended with a bit of a high note, this week's activity shows more negative than positive for the indicators. 

Case in point, let's look at the NYSE. The last 5 weeks have shown more 52 week lows than highs.


A look at the NYSE Advance Decline 200 day moving average on Stockcharts shows we crossed below the line at the end of September.


Finally, the major indexes have either crossed below their 30 week moving average or are touching the moving average line.

The indicators are now red.


Sunday, May 28, 2023

Stock Market Update - May 28, 2023

 As we await a debt ceiling compromise between democrats and republicans the market is up and down and up and down again. As I write this post, it appears a preliminary deal has been struck and is ready for a vote this coming week.

From a technical standpoint, it appears we are in Phase 2 Advancing for the NASDAQ and SPY. The DOW retreated this past week. All positive signs as it often shows a move out of safety (DOW) to more speculative stocks.

Lots of Tech stock talk this week too with NVIDIA posting fantastic earnings.


An interesting read on StockCharts by Mary Ellen McGonangle.


Sunday, January 15, 2023

January 13 2023 - Stock Market Update

 Markets are performing a little better so far in 2023. The stage analysis indicators are moving into positive territory with the exception of the NASDAQ which has been affected by weakness in tech and the ups and downs of Tesla via Mr. Musk.

Let's take a look at some charts. The Dow may be entering into Stage 1 as shown below with the upturn of the 30 week moving average.


For the first time in over a year, Indicator #5 is positive. For this indicator, we look to see if the NYSE Advance-Decline (A-D) is above or below its 200 day moving average. The divergence between the advances and declines is plotted on a chart, and the 200 day moving average is also plotted.


At this point I am watching and gently buying shares of some stock that I think may be in for an upward climb.


Saturday, October 15, 2022

Stock Market Update: Shorts vs Buyers SDS vs. SPX

 This week the market had a few days with big swings up and then back down again. A lot of action.

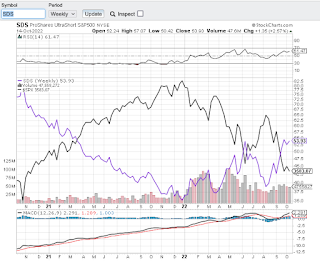
One comparison I like to do is to compare the short SPY ETF to the S&P index. As we can see below the last cross over occurred in September. The SDS is above the SPY signalling we have more short action than buying action. Not a good sign.

October can be a loss harvest month with the mutual funds and it's possible that is contributing to some of the downside. All indicators remain in the red.


Sunday, June 26, 2022

Stock Market Bounce - June 24, 2022

This week we had a little bounce. Interestingly though, there were still more new lows than new highs in the NYSE.

Let's compare the 2008-2009 downturn in the NasDaq to our current downturn.


 2008 - 2009 crash - Long Period of time - about 1 year and 4 months


Current downturn in NasDaq - about 7 months so far.


We are obviously still in Stage 4 - downturn! Let's see what develops over the next few months.


Sunday, June 5, 2022

Stock Market Update - June 3, 2022

This week and the week prior, saw some stabilization on the downward trend we've been in since December 2021. All my indicators remain in the red however. We don't know if this is just a pause and we don't know which direction we will go from here. We are still in Stage 4 decline.

Looking at market sectors, the only well performing sectors for the last month are Energy, Utilities and Materials. Especially interesting is XLE which lagged the market recovery from COVID up until recently as it now outperforms the others. See this Stockcharts graph.


Saturday, April 23, 2022

Stock Market Update - Continued Down Trend

 The markets continue to be in Stage 4 Decline. The sell-off while prolonged is not as deep as the last one that occurred in 2020. Tech is hardest hit this time around.


My friend Jimmy had recommended iBonds to me a few months ago. They are a great way to earn a high interest rate with some caveats. Including them in your portfolio helps balance out market downturns. With inflation going up they are about to increase to near 9% return.

To learn more read these articles:


Sunday, March 20, 2022

Stock Market Update - March 18, 2022 - Little Bounce

We are still in Stage 4 decline, however all 3 indexes did have a nice uptrend for the week.

One indicator to keep an eye on is the Dow vs Gold. They are about to cross. If they do indeed cross, then I view that as a sign of trouble. As of the end of this week, the bad trend reverted with gold dipping down. See this stockcharts link.

The government in contemplating an end to Daylight Savings - please let it be so!

The Sunshine Protection Act has passed the Senate and is awaiting House review.

Unfortunately the war in Ukraine continues.


Sunday, March 6, 2022

Stock Marrket Update - Stage 4 - Stormy Weather

No doubt about it, we are in Stage 4 downtrend. All of my indicators are in the red. The last one to go red is the global DOW which is now below its 30 week moving average.

Another indicator to watch is the 10 week moving average vs the 30 week moving average. The cross has occurred with the NASDAQ taking the most heat.  

The Russian invasion of Ukraine is sadly a driver, along with inflation (gas prices anyone?), and supply chain issues. For once, COVID is not behind the bad news as most states lift their mask mandates and hopefully we return back to normal.


CNN's Fear and Greed indicator is at the lowest I've seen in a long time.


Sunday, February 20, 2022

Stock Market Update - Feb 18, 2022 - Gold approaching Dow

 Another bad week for stocks. One of the indicators I like to use is the Gold vs. Dow chart. At the moment, gold is approaching the Dow's moving average line.


Generally when gold prices rise and stock prices go down it is a sign of a bad market. 


Sunday, January 16, 2022

Stock Market Update - January 14, 2022

 My indicators are mixed this week. Nothing too horrible, mostly minor showing of weakness in some indicators. The NASDAQ is below its 30 week moving average just a little bit, the NYSE had more lows than highs, and the NYSE/DJIA were both down.

One of my favorite charts, the Dow vs GLD, shows the Dow outperforming gold. I view this as a good sign.


Have you tried to buy a car lately? Used or new they are hard to come by. Dealer lots are empty. So empty in fact that they have used vehicles in the show room and dissuade you from buying used (where they usually make a nice profit) for fear they won't have any example of the model to show potential buyers. Wow.

What's the problem? A chip shortage. The US is looking to boost more manufacturing here.

How about groceries? Tried to buy any of those lately? Around here the veggies shelves are empty. My plan? Go to the local farmer's market. A good idea anyway. Lots of fresh veggies and not pesticides to boot!


Sunday, December 12, 2021

Stock Market Update - December 10, 2021 - Bounce

Stocks bounced back this week with the major indexes bouncing back above their 30 week moving averages. Last week I thought we might be heading into stage 3 but not so fast!

Even Indicator 5 - NYSE Advance-Decline 200 Day Moving Average bounced up.


CNN's Fear and Greed improved slightly this week as well.


On the other hand, it would appear we are now back to wearing masks. At least in New York. Starts on Monday.

My friend J.A. provided a nice link to an article by Jill Mislinski on Advisor Perspectives, that takes moving average analysis to a macro view of 10 months vs what we use here which is 30 week. It's a good read and I plan to add it to my monthly review.

Saturday, November 27, 2021

Market Update November 26, 2021 - Bumpy COVID Varient in Africa

Friday saw a sell off of about 2% to 2.5% amid concerns of a new COVID varient in South Africa.

Let's look at the indicators.

  1. DJIA vs 30 week MA: Touching the moving average line
  2. S&P  vs 30 week MA: Above
  3. Nasdaq vs 30 week MA: Above
  4. Global DOW vs 30 week MA: Below
  5. DJIA vs NYSE A-D: Both Down
  6. Divergence: DJIA vs NYSE High/Low: Both Down
  7. 200 Day MA NYSE A-D: Above
  8. NYSE  52 Wk Highs-Lows Diff: -182


Interesting articles for further reading:

Sunday, October 10, 2021

Will this be a bad October?

 It looks like we are approaching a correction, with the major indexes touching their 30 week moving average lines or going just a little bit below. We are due for one, the question is whether it will be a large or little correction.


Wishing Wealth has an interesting post... feels trouble ahead as interest rates ahead.


Saturday, January 2, 2021

2020 End of Year Review

 Here is a quick breakdown of how 2020 fared for stocks.


  • Dow 9.7%
  • S&P 17.63%
  • NASDAQ 45%
  • GLD 23%
  • TIP 10%
  • SDS (Ultra short S&P) -48%


Not a good year for the DOW in comparison to the other indexes. Great year otherwise.


Sunday, August 23, 2020

Stock Market Update Week Ending Aug 21, 2020 - NYSE vs Dow Trend Chart

The market remains mixed as posted last week.

This week I want to look at a chart from Stan's book that used to be available on the Barron's site but they have since retired it so I make my own. It is the Dow vs. the NYSE Advance-Decline ratio.  We are looking for changes in trend. If both the Dow and NYSE A-D are going in the same direction or are they diverging?

In January they diverted and it turned out to be a signal of the drop. This week we see a potential divergence. What is important to note is that defensive stocks are in favor when the Dow moves up but the NYSE A-D moves down. We need to see if this continues as one week does not make a trend. 

This indicator should not be used on its own.


Stockcharts S&P shows the S&P began decline in February.

Sunday, August 2, 2020

Let's look at the Stan Weinstein indicators for the market as a whole.

Are the Indexes above their 30 week moving average?
  1. DJIA - Yes but the MA slope is down
  2. S&P - Yes with a flat MA
  3. NASDAQ - Yes with an upward MA
  4. GDOW - Yes but the MA slope is down

5. DJIA vs NYSE A-D Positive? Yes, the DOW is down while the NYSE is up.
6. DJIA vs NYSE 52 Wk High/Low? No, both are down
7. 200 Day MA NYSE A-D? Yes
8. NYSE 52 Week Highs vs Lows Differential? Yes
9. DOW price to dividend ratio? No, and personally I don't think this indicator works in our current market since the Fed stepped in after the 2009 market crash.

Essentially we have 6/8 positive, however 3 of the indexes are a very weak positive. The price might be above the moving average line, but the moving average is not on an uptrend for the DOW, S&P and Global DOW.

I am going to throw gold in as an contrarian indicator. It continues to be on a tear and that generally does not bode well for the overall market.


Sunday, July 26, 2020

Stock Market Update as of July 24, 2020 - COVID Continues, Gold Rises, Dollar Falls

I keep thinking gold has hit a top, it must be, but then as things continue on, it appears it may still be in stage 2. The dollar is falling, COVID flareups and the ramifications for people and businesses continues, however, the overall market indexes are all still above their 30 week moving averages. What is a cat to think?

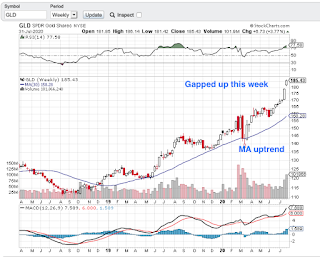
I bought some of the Gold ETF in 2017 as a hedge. Didn't think too much of it and let it sit there as a rainy day investment. The question for me now is do I buy more or wait it out? In reviewing the chart, it looks like there is room for more advancement before GLD enters into stage 3. A stop loss is in order at $160. Note the resistance to move past is the $179 high in 2011. This week can be key to see if it can plow through that resistance line.


A ChartMill chart below, confirms gold is in stage 3. (ChartMill has Weinstein indicators).


Sunday, July 12, 2020

Stock Market Update: July 11, 2020

The market continues to prove itself fairly resilient. Some say it is related to the fed policy. Technology has benefited from the work from home and stay at home mandates in reaction to the COVID pandemic. 

If the SDS ETF which is a hyper short vehicle is any indication, the markets are okay for now.  In the 2009 crisis, shorts were an indicator of how the market was doing. 


Here is a snapshot of how many COVID cases the US has as of this week.
and a comparison to the flu season:


We are living in interesting times indeed.