
Let's look at the Stan Weinstein indicators for the market as a whole.
Are the Indexes above their 30 week moving average?
- DJIA - Yes but the MA slope is down
- S&P - Yes with a flat MA
- NASDAQ - Yes with an upward MA
- GDOW - Yes but the MA slope is down
5. DJIA vs NYSE A-D Positive? Yes, the DOW is down while the NYSE is up.
6. DJIA vs NYSE 52 Wk High/Low? No, both are down
7. 200 Day MA NYSE A-D? Yes
8. NYSE 52 Week Highs vs Lows Differential? Yes
8. NYSE 52 Week Highs vs Lows Differential? Yes
9. DOW price to dividend ratio? No, and personally I don't think this indicator works in our current market since the Fed stepped in after the 2009 market crash.
Essentially we have 6/8 positive, however 3 of the indexes are a very weak positive. The price might be above the moving average line, but the moving average is not on an uptrend for the DOW, S&P and Global DOW.
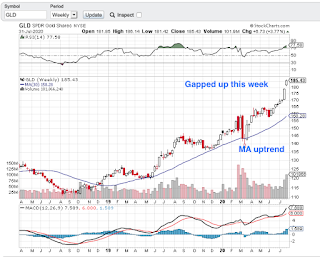
I am going to throw gold in as an contrarian indicator. It continues to be on a tear and that generally does not bode well for the overall market.

No comments:
Post a Comment
Note: Only a member of this blog may post a comment.