Saturday, December 26, 2020

Stock Market Update: December 25, 2020

 The market continues to go full steam ahead. All indicators are green.

Cryptocurrencies are also doing well. Bitcoin stockcharts link.

Appears to be in stage 2 or stage 3.


COVID vaccines are being distributed worldwide and the hopes are that we can start to get back to normal in the spring.


Sunday, December 13, 2020

Stock Market Update - Week Ending 12/11/20

 There has been some changes in the market as we get news that the FDA approved emergency use of the COVID-19 vaccine. "While not an FDA approval, today’s emergency use authorization of the Pfizer-BioNTech COVID-19 Vaccine holds the promise to alter the course of this pandemic in the United States,” said Peter Marks, M.D., Ph.D., Director of the FDA’s Center for Biologics Evaluation and Research.

With anticipation that the other vaccines will also get approved, and preparation for distribution of the Pfizer-BioNTech vaccine, there is some hope on the horizon. 

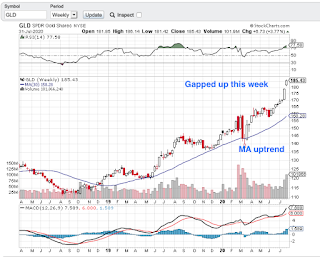
Now may be the time to trim gold if you have it. With the good news on COVID and the Gold ETF moving below it's 30 week moving average line, gold may be moving into Stage3. The moving average line itself is starting to flatten out. We will see.


Sunday, November 29, 2020

Stock Market Update: Week of November 27, 2020

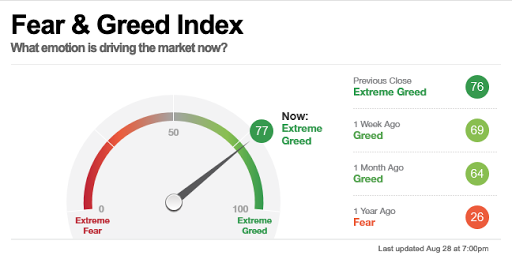
 It defies logic considering how bad the economy is, but the market is spiking up. CNN's Fear and Greed indicator is the highest I've seen. Extreme greed.


All of the indicators are currently green. COVID vaccine news continues as more options came out this week. Five are in Phase 3 trials.

As of November 24, 2020, large-scale (Phase 3) clinical trials are in progress or being planned for five COVID-19 vaccines in the United States:

  • AstraZeneca’s COVID-19 vaccine
  • Janssen’s COVID-19 vaccine
  • Moderna’s COVID-19 vaccine
  • Novavax’s COVID-19 vaccine
  • Pfizer’s COVID-19 vaccine​

The market seems a little frosty to me. Gold broke below it's 30 week moving average. Tread lightly.


Saturday, November 21, 2020

Stock Market Update: November 20, 2020

The markets are remaining positive and gold is showing signs of moving into stage 3. The moving average line is still on an uptrend however the weekly end is sloping down. This week brought news of multiple COVID-19 vaccines and some hope. Both
Pfizer/BioNTech and Moderna announced positive results.


Bitcoin is seeing new highs.


Stay frosty!

Saturday, November 7, 2020

Stock Market Update: Week Ending November 6, 2020

 The stock market had a nice bounce this week while we wait for the results of the Presidential Election. It's pretty close. According to The Associated Press, as of this morning, it Biden has a small lead over Trump. If it plays out anything like the Bush vs. Gore election, we may have to wait until December to know who wins.


In 2000, the markets were already on a downturn prior to the election so I would be careful in making any predictions on the impact of this one on the market. Plus, we have the whole COVID pandemic to deal with and there is no comparison to that in 2000.

From a stage analysis, we are still in Stage 3.

Sunday, October 25, 2020

Stock Market Update - October 23, 2020

Not much change in the stock market. It continues to hold steady. The Moving Average line on the global DOW is not slanting upward which is a positive sign.

With the election a couple of weeks away, Stock Chart's Three Takes on the Presidential Cycle article by David Keller is timely. Stan talks about presidential cycles in his book and I think Tom McClellan pretty much presents a similar viewpoint.

It's been awhile since we've looked at COVID-19. I am hoping the two charts below from the CDC provide some glimmer of hope. Cases are going up, but deaths are not.

 Total Cases


Total Deaths


Monday, October 5, 2020

Market Update: Oct 3, 2020

News that President Trump has contracted COVID-19 made headlines on Friday. He appears to be doing better as of this morning (WSJ).

It's possible the major indexes are in stage 3. Gold continues to be in Stage 2 but is showing signs of possibly moving into Stage 3 as well. Stimulus talks are in the works.

CNN's Fear & Greed went into greed last week. It's been in greed for awhile.

We will see.


Sunday, September 27, 2020

Stock Market Update: September 25, 2020

There is a lot of uncertainty in the air. We have the upcoming election, talks of fast tracking a COVID-19 vaccine, and in general malaise and people are sick and tired of the lock down. 

The major indexes are above their 30 week moving averages however they are not looking to be in good shape as evidenced by the S&P chart below.


Gold appears to be consolidating. Its moving average line is still sloping up however which is a positive indicator.

I am in a wait and see mode at the moment and expect some turbulence with the election.

Sunday, September 13, 2020

Stock Market Update: September 11, 2020

This week saw a little pull back however from a long view of weekly and monthly charts, the major indexes are still above their 30 week moving averages. Gold continues to be above it's moving average as well, but could be entering into Stage 3. 

The DOW shuffled the companies. Out are ExxonMobile, Raytheon and Pfiezer. In are Salesforce, Amgen and Honeywell. Also impacting the DOW is the Apple 4 for 1 stock split.

Holding steady for now.


Monday, August 31, 2020

Stock Market Update: End of August 2020

 The market continues to move up. CNN's Fear and Greed indicator is reading greed.


I find this chart I came up with to be interesting. The Gold ETF, GLD, compared to the DOW price action. If you notice, gold went up prior to the big market decline in 2009.  I circled the cross overs however you can see the price action diverged between the two when there was a change in the market. At the moment both are on an uptrend. In my opinion, if a COVID-19 vaccine comes out, then gold will probably drop, at least temporarily. It could continue to hold steady though as governments around the world print money and the dollar keeps losing value.


Sunday, August 23, 2020

Stock Market Update Week Ending Aug 21, 2020 - NYSE vs Dow Trend Chart

The market remains mixed as posted last week.

This week I want to look at a chart from Stan's book that used to be available on the Barron's site but they have since retired it so I make my own. It is the Dow vs. the NYSE Advance-Decline ratio.  We are looking for changes in trend. If both the Dow and NYSE A-D are going in the same direction or are they diverging?

In January they diverted and it turned out to be a signal of the drop. This week we see a potential divergence. What is important to note is that defensive stocks are in favor when the Dow moves up but the NYSE A-D moves down. We need to see if this continues as one week does not make a trend. 

This indicator should not be used on its own.


Stockcharts S&P shows the S&P began decline in February.

Sunday, August 16, 2020

Stock Market Update: Week Ending August 14, 2020

 From a stage analysis view, markets are in mixed territory. I rate 4 of the indicators as neutral. The DOW, global DOW and S&P are above their 30 week moving average line, but the MA is sloping down or flat. Not exactly a sign of strength.

One of my favorite Stan Weinstein charts is the NYSE High Low Differential which looks at the difference between the number of stocks hitting their 52 week highs and 52 week lows.  Each week I look at the number of new 52 week highs and the number of new 52 week lows. For example, this week we had 44 stock reaching new highs and 7 stocks reaching new lows. Not much action at all. In a strong recovery the numbers are more like 389 to 30 respectively. So while this indicator is in the green, it's not by much and the highs versus lows is not that broad.

Here is my chart. I have found that this one chart can give a pretty decent indicator of the overall market, even though it's a very simple chart.


Also keep in mind we are heading into an election plus COVID is not over yet so the market can get pretty choppy yet.


Sunday, August 2, 2020

Let's look at the Stan Weinstein indicators for the market as a whole.

Are the Indexes above their 30 week moving average?
  1. DJIA - Yes but the MA slope is down
  2. S&P - Yes with a flat MA
  3. NASDAQ - Yes with an upward MA
  4. GDOW - Yes but the MA slope is down

5. DJIA vs NYSE A-D Positive? Yes, the DOW is down while the NYSE is up.
6. DJIA vs NYSE 52 Wk High/Low? No, both are down
7. 200 Day MA NYSE A-D? Yes
8. NYSE 52 Week Highs vs Lows Differential? Yes
9. DOW price to dividend ratio? No, and personally I don't think this indicator works in our current market since the Fed stepped in after the 2009 market crash.

Essentially we have 6/8 positive, however 3 of the indexes are a very weak positive. The price might be above the moving average line, but the moving average is not on an uptrend for the DOW, S&P and Global DOW.

I am going to throw gold in as an contrarian indicator. It continues to be on a tear and that generally does not bode well for the overall market.


Sunday, July 26, 2020

Stock Market Update as of July 24, 2020 - COVID Continues, Gold Rises, Dollar Falls

I keep thinking gold has hit a top, it must be, but then as things continue on, it appears it may still be in stage 2. The dollar is falling, COVID flareups and the ramifications for people and businesses continues, however, the overall market indexes are all still above their 30 week moving averages. What is a cat to think?

I bought some of the Gold ETF in 2017 as a hedge. Didn't think too much of it and let it sit there as a rainy day investment. The question for me now is do I buy more or wait it out? In reviewing the chart, it looks like there is room for more advancement before GLD enters into stage 3. A stop loss is in order at $160. Note the resistance to move past is the $179 high in 2011. This week can be key to see if it can plow through that resistance line.


A ChartMill chart below, confirms gold is in stage 3. (ChartMill has Weinstein indicators).


Sunday, July 19, 2020

Stock Market Update: July 17, 2020 - Let's Look at Gold

Stocks are doing well from a Stage Analysis view, with the DOW joining the other major indexes when it finally move above its 30 week moving average. Let's see if it sticks.

Gold has been getting a lot of attention lately as it reaches highs lately and the US government printing money like crazy. See this interesting Barron's Article.

I thought it would be interesting to compare gold to the DOW and S&P. If the recent crossover is any indication and works like it did in the 2009 downturn, gold may continue to move upwards. The orange line in each chart represents GLD (ETF).


How about technology? It also is on an upward trend. Martin Pring has a great blog post on it. The next coming week's will help us see if the trend will continue or reverse.


Sunday, July 12, 2020

Stock Market Update: July 11, 2020

The market continues to prove itself fairly resilient. Some say it is related to the fed policy. Technology has benefited from the work from home and stay at home mandates in reaction to the COVID pandemic. 

If the SDS ETF which is a hyper short vehicle is any indication, the markets are okay for now.  In the 2009 crisis, shorts were an indicator of how the market was doing. 


Here is a snapshot of how many COVID cases the US has as of this week.
and a comparison to the flu season:


We are living in interesting times indeed.

Sunday, June 28, 2020

Stock Market Update: June 28, 2020

Market indicators are mixed. The recent upturn appears to be on shaky ground with Nassim Taleb calling for hedging a long tail. 

With that in mind, let's see where gold is from a stage perspective using the GLD ETF via stockcharts.

The moving average is sloping up, the close is above the 30 week moving average and fundamentals for gold are improving if you consider that it is widely viewed as a hedge for the market. The chart below shows the peak of gold during the 2009 market downturn was around $180. Current prices is $162. If we consider 180 to be the ceiling then we may have room for higher prices.


How about looking at the tech sector? The NasDaq continues to be in a stage 2 accumulation phase.


Overall, the market is choppy however, and that indicates we are still in phase 4 overall. The DOW and S&P are not in stage 2 but are still in stage 4.
 

Sunday, June 7, 2020

Stock Market Update: Week Ending June 5, 2020

Big rebound in markets this week with an upbeat jobs report.

From a stage analysis perspective, we have the following:
  • DOW & S&P : Stage 4. The 30 week moving average is still sloping down or is flat.
  • NASDAQ: Stage 1: Closing price above the 30 week moving average and the moving average is sloping upward
 The CNN Fear and Greed index is showing a little bit of improvement the first time a long time.


Many areas in the US are re-opening in phases and fingers crossed, we can re-open without a resurgence in cases. We all need to get out of the house!!  
 

Sunday, May 31, 2020

Stock Market Update: End of May 2020

Well we're at the end of May and it's been a ride! Markets rebounded and there is hope, at least here in New York, that we can start to re-open. NY has a 4 phase approach. Note, all have extensive rules, see the official page for more information.

  • Phase 1: 
    • Construction 
    • Agriculture, Forestry, Fishing and Hunting 
    • Retail - (Limited to curbside or in-store pickup or drop off)
    • Manufacturing 
    • Wholesale Trade 
  • Phase 2:
    • Offices 
    • Real Estate
    • Essential and Phase 2 in-store retail
    • Vehicle sales, lease, rentals
    • Retail rental, repair and cleaning
    • Commercial building management
    • Hair salons and barbershops (Yay)
    • NOT OPEN:
      • Malls
      • Dine-in and on-premise restaurant or bar service, excluding take-out or delivery for off-premise consumption;
      • Large gathering/event venues
      • Gyms, fitness centers, and exercise classes,
      • Video lottery and casino gaming facilities;
      • Movie theaters, except drive-ins; and
      • Places of public amusement
  • Phase 3:
    • The guidelines below apply to non-essential businesses in regions that are permitted to reopen, essential businesses throughout the state that were previously permitted to remain open, and commercial and recreational activities that have been permitted to operate statewide with restrictions
    • NOT OPEN: Restaurants and dine-in
  • Phase 4:
    •  NOT OPEN:
      • Arts / Entertainment / Recreation
      • Education
       
    Holy Cow! Can it get any more confusing??
The stock market on the other hand is more direct. Markets appear to be making a recovery with the major indexes either above their 30 week moving average or about to break through and above it.

Monday, May 25, 2020

Stock Market Update: Week Ending May 22, 2020

Markets are mixed. There are signs of hope as states start to reopen. The Wall Street Journal has a nice map.


Many are limiting gatherings to 10 people or less. It would be nice to see a little more flexibility in some of the restrictions. If a wine store can be an 'essential' business and allow foot traffic, then you would think some additional retail stores could also be open with managed foot traffic. We want our small businesses to stay open and functioning, they are the backbone of our towns.


The NASDAG continues to be in a Stage 1 uptrend, while the S&P and DOW remain in Stage 4 decline. GLD appears to be strongly in Phase 2.


Sunday, May 17, 2020

Stock Market Update - Week Ending May 15, 2020

From a stage analysis perspective, the market continues to be in Stage 4.
The NASDAQ continues to be in a stage 1, but the other indexes are in stage 4.


The CDC map for the week


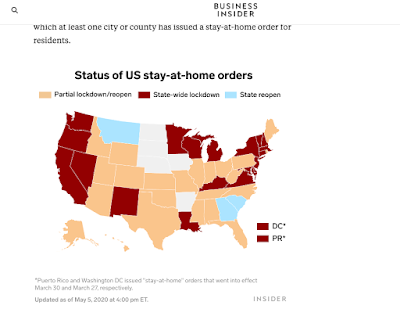
Stay at home orders map from Business Insider.


Sunday, May 10, 2020

Stock Market Update: Week Ending May 8, 2020

The stock market is starting to look like it is on a recovery which is confusing for some considering the job market. The stock market is a future looking beast, and it may be telling us that it sees a recovery next year.

Will we have a roaring 20's similar to the recovery after the Spanish Flu of 1918 - 1920?

There are differing opinions, here are three:
  • No lessons to be learned. The DOW rallied in the Spanish Flu and WW1 was underway. (ETF Stream)
  • A balanced view. Decline then recovery (Trader's Magazine)
  • Lockdowns and other measures were common, masks were required. Market's bounced back (Motley Fool)

States are beginning to work on re-opening. (Business Insider)


A look at this week's CDC COVID map.

Cheers. Pickles.

Sunday, May 3, 2020

Stock Market Update: End of April 2020

The market is on a wild ride, swinging from positivity to negativity with wide ranges. The DOW and S&P are in stage 4, the NASDAQ is in a possible stage 1.


COVID-19 continues to dominate the world. States in the US are beginning to plan re-opening business. Here is this week's COVID map. Note the new color purple used to designate cases above 28,764. 


Caution with stocks is recommended as we still in a stage 4 and the candlesticks in the charts above show wild swings in stock price movements. 


Monday, April 27, 2020

Stock Market Update: Week Ending April 24th

Markets rebounded a little this week. Of the 3 major indexes, the NASDAQ is the only one above, just slightly, the 30 week moving average line. States are looking to begin reopening. New York is hoping to reopen with precautions on May 15th. New York city has been especially hard hit by the pandemic, and is looking to reopen by June 1st.

This week's map from the CDC remains colorful.


How will the workforce look after the COVID virus? Will this finally be the death of the open office? Will telecommuting aka working-from-home become more acceptable? Lot's of speculation out there. Check out this Market Watch article. 


Saturday, April 18, 2020

Stock Market Update: Week of April 16, 2020

Markets rebounded  little bit this week. The NASDAQ tip-toed above it's 30 week moving average, while the others are still beneath their MA line.


CNN's Fear & Greed Index is moving from it's position on the far left towards the center. Another hopeful sign.


COVID continues to spread across the US but some states are starting to recover too.


Many are looking forward to re-opening the country. Optimistically in May.

Saturday, April 11, 2020

Stock Market Update: Week Ending April 11th and COVID Update

The market was up this week as it reacts to hope from government action to help people who are impacted by the virus financially. 


The virus continues to spread. Here is this week's CDC Map. More states are being impacted.


There have been some hopeful developments, including a test to detect antibodies and requests for people who have recovered to donate blood.

Gilead's drug to fight the virus may start testing next week.  (GILD)

This week ended with a bit of surge in the market. 

However, we are still in a stage 4 with the indexes below their 30 week moving average.


Working from home? How's your back? Movement is important. Some helpful tips:


Hoping we reach the peak soon and can start to return to normal.


Saturday, April 4, 2020

Stock Market Update: April 3 2020

Coronavirus aka COVID-19 continues to dominate the headlines and people's state and mind.


The only sector with even a slight hint of positive signal is Consumer Staples. See Fidelity's chart below.
Some interesting looking stocks within that group are KMB, PG, WDFC and of course CLX. Note, the only one of those above it's 30 week moving average line is Clorox. Walmart (WMT) is also looking good.


This is a stage 4 market, and per Stan, you don't invest in a stage 4 market. Go at your own risk.

Saturday, March 28, 2020

Stock Market Update - Week Ending March 27 2020 - COVID 19 update

Here in the US, this week has been bumpy. The government passed a 2$ Trillion dollar stimulus bill on Friday. The economy is taking a big hit with the lockdown of non-essential businesses in many states in an attempt to flatten the infection rate curve. The idea is to slow down the rate of infection to make sure hospitals don't get overwhelmed with cases all at once. Supplies and equipment needed, such as ventilators, must be available to help people with severe impact to their lungs.

The CDC infection rate map is below.


Hopefully, a vaccine will be found, or at least a better treatment for those who get infected.

Remember we are clearly in Stage 4.


Stage 1 - Basing Phase 
  •  30 week moving average loses its downward slope and starts to improve
Stage 2 - Advancing Phase 
  • 30 week moving average slopes up. 
  • Close is above the 30 week moving average, with higher lows
  •  Fundamentals improve
Stage 3 - The Top Phase 
  • Loses momentum
  • Choppy market
  • 30 week moving average loses upward slope and flattens 
Stage 4 - Declining Phase
  •  Close line below Moving average
  •  30 week moving average is sloping down

Be safe.


Sunday, March 22, 2020

Stock Market Update: Stage 4 and COVID-19

The market had a wild ride this week with the COVID-19 pandemic hitting the US more broadly. States are responding with heavy measures that impact people and businesses hard. We are officially in a Stage 4 market.


The CDC map of the COVID-19 status in the US show widespread movement of the virus.


Aside from the market reaction, COVID-19 is impacting people and will hopefully abate soon.

Sunday, March 8, 2020

Stock Market Update - COVID 19

News this week continues to be on the Coronavirus-2019.

The US impact as of this week is shown below in this chart from the CDC.


Not surprisingly, the CNN Fear and Greed index is set to Extreme Fear.


The S&P is showing Stage 4 signs.


Develop a watch list and know that the broad market will impact all stocks.

Recommendations for the virus are pretty much the same as for the flu. CDC recommendations and hand-washing. Hand sanitizers are for when you don't have access to soap and water.


Sunday, March 1, 2020

February 2020 Stock Market Update

The coronavirus COVID-19, is front and center this month as the stock market reacts to spread of the virus across the globe. Depending on what you read it's either time to panic or everyone is overreacting. The US is starting to see negative impacts and unfortunately some deaths. CNN update.

The CNN Fear and Greed indicator is at the lowest I can remember seeing it.


All of the Stage Analysis Indicators are now in the red. We most likely are entering into stage 4. StockCharts Graph Link.