Showing posts with label Broad Stock Market Indicator. Show all posts

Saturday, October 7, 2023

Stock Market Update - 1st Week in October

While Friday ended with a bit of a high note, this week's activity shows more negative than positive for the indicators. 

Case in point, let's look at the NYSE. The last 5 weeks have shown more 52 week lows than highs.


A look at the NYSE Advance Decline 200 day moving average on Stockcharts shows we crossed below the line at the end of September.


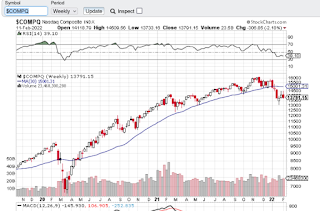
Finally, the major indexes have either crossed below their 30 week moving average or are touching the moving average line.

The indicators are now red.


Sunday, September 24, 2023

Stock Market Update - September 24, 2023

 The promising look to the market in the last few months, specifically, Stage 1, appears to be heading in the opposite direction. Almost all the indicators are about to turn red.

Here is a look at a couple of charts.

Indicators 1 - 3 - 30 Week Moving Averages

All are approaching their 30 week moving average lines.

The Dow Chart


The S&P Chart


Indicator 5: NYSE A-D 200 Day MA

NYSE Advance-Decline’s 200 days moving average to see if it is above (bull) or below (bear). We could be about to go into bear territory.


Be wary. October is coming up and sometimes it is a rough month!


Sunday, May 28, 2023

Stock Market Update - May 28, 2023

 As we await a debt ceiling compromise between democrats and republicans the market is up and down and up and down again. As I write this post, it appears a preliminary deal has been struck and is ready for a vote this coming week.

From a technical standpoint, it appears we are in Phase 2 Advancing for the NASDAQ and SPY. The DOW retreated this past week. All positive signs as it often shows a move out of safety (DOW) to more speculative stocks.

Lots of Tech stock talk this week too with NVIDIA posting fantastic earnings.


An interesting read on StockCharts by Mary Ellen McGonangle.


Sunday, January 15, 2023

January 13 2023 - Stock Market Update

 Markets are performing a little better so far in 2023. The stage analysis indicators are moving into positive territory with the exception of the NASDAQ which has been affected by weakness in tech and the ups and downs of Tesla via Mr. Musk.

Let's take a look at some charts. The Dow may be entering into Stage 1 as shown below with the upturn of the 30 week moving average.


For the first time in over a year, Indicator #5 is positive. For this indicator, we look to see if the NYSE Advance-Decline (A-D) is above or below its 200 day moving average. The divergence between the advances and declines is plotted on a chart, and the 200 day moving average is also plotted.


At this point I am watching and gently buying shares of some stock that I think may be in for an upward climb.


Sunday, September 18, 2022

Saturday, August 27, 2022

Stocks Take a Tumble - Fed Chair Speech of Pain

 Just when it looked as though the market was starting to look up, with the big indexes moving above their 30 week moving average, Fed Chair Powell let it rip that we are in for more pain. Yikes!

As Mary Ellen McGonagle put's it "Fed Chair Powell's comments today that bringing down prices "is likely to require a sustained period of below-trend growth and an increase in unemployment" brought the markets to its knees."

My favorite chart is offered up by Jill Mislinski at Advisor Perspectives in this article


With all that, we are clearly still in Stage 4 decline. Here is a chart showing where we are on the S&P. Notice the 30 week moving average continues to slope down.


Saturday, July 30, 2022

Stock Market Update - July 29, 2022

This week ended with a glimmer of hope as the market bounced up a little bit. From a stage analysis perspective, we are still in stage 4 because the major indexes are still below their 30 week moving average and all the other indicators are also in the red.

Notable news include:


If we have another couple of good weeks, we may see the major indexes above their moving average...


Saturday, May 14, 2022

Stock Market Update - Stage 4 Decline Continues

 Even with the little uptick on Friday, the overall week is down and we continue to be in Stage 4 Downturn. All indicators remain in the negative.

  • Stage 4 - Declining Phase
    • Close line below the 30 week Moving Average (MA)
    • 30 week Moving Average is sloping down


Inflation remains high, inventory of goods remains slow and sluggish, the Russian/Ukrainian war continues, COVID is still an issue, and CNN's Fear and Greed is at Extreme Fear.


Sunday, April 3, 2022

Stock Market Update - April Fool's 2022

 This week saw a little bounce, but the major indexes have not broken above their 30 week moving average lines.

Wishing Wealth feels this could be a bad sign. Too many breakouts not making it.

Jill Mislinski at Advisors Perspectives is showing mixed signals with the S&P analysis signaling to be in cash, however, the longer view of the Ivy Portfolios are a mix of cash and invested.

CNN's Fear and Greed has moved up a bit. It had been in the dumps for weeks.


We shall wait and see.

Sunday, February 13, 2022

Stock Market Update - Feb 11, 2022 - Bear Market - Stage 4

Looking at the Stan Weinstein indicators, we are in a Bear Market. All indicators except for the Global Dow are negative. 

COVID cases are down and hopefully life returns to normal in 2022. So what is the problem? Inflation, Ukraine/Russia tension according to this Wall Street Journal article.

Tech, led by Facebook is taken a beating. FANG stocks are not looking too good. Apple is doing fine but the others are not.   The Apple vs Facebook battle over our data is an interesting one. 

Let's look at the charts. At this point, just a minor correction. We will have to wait and see if it stays minor or gets larger.


Saturday, January 29, 2022

Stock Market Update - January 28, 2022

 We are in a bit of a correction. The NasDaq is now in Stage 4 decline because its 30 week moving average line is now sloping downward.


The other major indexes are in Stage 3 and possibly heading for Stage 4.

One of my favorite Stan Weinstein indicators is to chart the difference between NYSE stocks hitting their 52 week high vs those hitting their 52 week low. He said not to use it alone but in conjunction with the other indicators. If we take a look at it now, it shows that we are in the beginning of a correction. How far it goes is hard to say, this could be a normal correction or if tensions continue with Russia, inflation doesn't budge and if there are more restrictions due to COVID which is also driving inflation, then it could continue. Hard to say. 


Sunday, January 2, 2022

2021 Stock Market Year End Performance

 2021 was a good year for the market! In general up 20%. Not bad. Who would have thought a pandemic would be good for the stock market?

Here's how the major indexes performed:

  • S&P 26.9%
  • NasDaq 21.39%
  • DOW 18.73%
  • GLD -6.24%
  • XLE (Energy ETF) 17.54%
  • TIP (Treasury Inflation Protected Bonds) 1.10%
  • Bitcoin 46.65%

A few visuals to show the year.

S&P 


NASDAQ


DOW


BitCoin to US Dollar


Monday, September 20, 2021

Stock Market Update Week Ending September 17, 2021

The Stage Indicators are beginning to point to weakness in the market with the major indexes about to breach their 30 week moving average line. We are due for a pullback and may see one in the coming weeks.

The FINVIZ.com heatmap from Friday is mostly Red.


Drivers appear to be financially related vs. COVID. China's Evergrande may not be able to pay it's debt, talk of Fed tapering, and debt ceiling debates.


Here is a snapshot of the S&P which appears to be entering into Stage 3.


Hang tight.


Saturday, July 10, 2021

Stock Market Update: July 8, 2021

 From a stage analysis viewpoint, we are in Stage 2 Accumulation (see stage analysis overview here) with the market continuing to go up.

One of the gauges I like to look at is the Dow vs NYSE Advance-Decline. (Barron's used to produce it but stopped so I make my own chart.) It's a bad sign for the market when the Dow is advancing more than the NYSE, which we see in March of 2020 when COVID hit. Likewise, it's a positive sign when the NYSE is above the Dow. That's where we are now. It's one of the biggest divergences I've seen in a while.


Stories of interest:


Sunday, June 20, 2021

Stock Market Update: June 18, 2021 - Signs of Inflation

 For the first time in a while, markets were down at the end of the week. The worst since February. 

 Contributing factors include expected rate hikes by the Fed.

From a stage analysis view, we are still flying high, but and this is a big but, the 3 major indexes look poised to go below their 30 week moving averages. If this happens we may be entering stage 4.

CNN's Fear and Greed indicator is the lowest it has been in quite some time.


Housing continues to be out of control! Prices are skyrocketing. COVID cases are way down in the USA and there is hope for the future.


Saturday, June 5, 2021

Stock Market Update - June 4, 2021

Market continue to be in an uptrend. All indicators remain up. Jobless claims are going down and with the COVID vaccine being distributed the economy looks to be poised for a recovery. I am interested in energy and travel stocks.

XLE Spider is showing signs of recovery and has a ways to go to get to the last high. Even with the move to electronic vehicles we will still need energy for years to come.


An interesting set of news articles surfaced this week related to the COVID outbreak's potential source being the Wuhon Lab. Vanity Fair has a nice article here

Bitcoin has been a bit of a ride these last couple of weeks as Elon Musk is in then out. 


Saturday, December 26, 2020

Stock Market Update: December 25, 2020

 The market continues to go full steam ahead. All indicators are green.

Cryptocurrencies are also doing well. Bitcoin stockcharts link.

Appears to be in stage 2 or stage 3.


COVID vaccines are being distributed worldwide and the hopes are that we can start to get back to normal in the spring.


Sunday, November 29, 2020

Stock Market Update: Week of November 27, 2020

 It defies logic considering how bad the economy is, but the market is spiking up. CNN's Fear and Greed indicator is the highest I've seen. Extreme greed.


All of the indicators are currently green. COVID vaccine news continues as more options came out this week. Five are in Phase 3 trials.

As of November 24, 2020, large-scale (Phase 3) clinical trials are in progress or being planned for five COVID-19 vaccines in the United States:

  • AstraZeneca’s COVID-19 vaccine
  • Janssen’s COVID-19 vaccine
  • Moderna’s COVID-19 vaccine
  • Novavax’s COVID-19 vaccine
  • Pfizer’s COVID-19 vaccine​

The market seems a little frosty to me. Gold broke below it's 30 week moving average. Tread lightly.


Sunday, September 27, 2020

Stock Market Update: September 25, 2020

There is a lot of uncertainty in the air. We have the upcoming election, talks of fast tracking a COVID-19 vaccine, and in general malaise and people are sick and tired of the lock down. 

The major indexes are above their 30 week moving averages however they are not looking to be in good shape as evidenced by the S&P chart below.


Gold appears to be consolidating. Its moving average line is still sloping up however which is a positive indicator.

I am in a wait and see mode at the moment and expect some turbulence with the election.

Sunday, August 23, 2020

Stock Market Update Week Ending Aug 21, 2020 - NYSE vs Dow Trend Chart

The market remains mixed as posted last week.

This week I want to look at a chart from Stan's book that used to be available on the Barron's site but they have since retired it so I make my own. It is the Dow vs. the NYSE Advance-Decline ratio.  We are looking for changes in trend. If both the Dow and NYSE A-D are going in the same direction or are they diverging?

In January they diverted and it turned out to be a signal of the drop. This week we see a potential divergence. What is important to note is that defensive stocks are in favor when the Dow moves up but the NYSE A-D moves down. We need to see if this continues as one week does not make a trend. 

This indicator should not be used on its own.


Stockcharts S&P shows the S&P began decline in February.