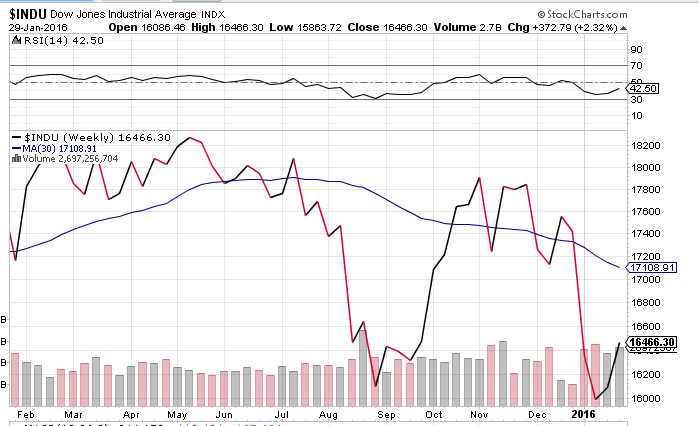
1 - 3. Major indexes vs. their 30 week moving averages. All three indexes have downward sloping 30 week moving averages and their close lines are still below the moving average. We are starting to see some minor improvements however, with the close line moving up over the last two weeks.
4. Convergence of NYSE AD and DOW. Both moved up this week. Click here to see Barron's chart.
5. NYSE 200 day Moving Average.The NYSE is still below its 200 day moving average. Another indicator gaining momentum on the moving average.
6. NYSE 52 Weeks Highs vs. Lows. First time in the green in months!
7. NYSE 52 Week High Low vs. Dow Convergence/Divergence. Both up.
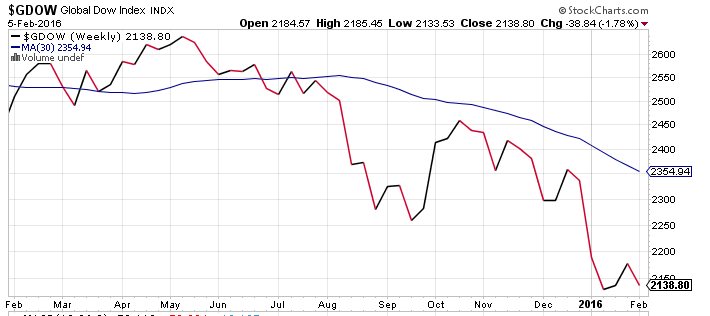
8. International Markets. The Global Dow is still below its 30 week moving average.
9. Cost of a Dividend on the DOW. Still costly at 37.88
My indicators continue show a Bear Market.
1 - 3. Major indexes vs. their 30 week moving averages. All three indexes have downward sloping 30 week moving averages and their close lines are still below the moving average.
4. Convergence of NYSE AD and DOW. Both moved up this week. Click here to see Barron's chart.
5. NYSE 200 day Moving Average.The NYSE is still well below its 200 day moving average.
6. NYSE 52 Weeks Highs vs. Lows. Small improvement from last week.
7. NYSE 52 Week High Low vs. Dow Convergence/Divergence. Both up.
8. International Markets. The Global Dow is still way below its 30 week moving average.
9. Cost of a Dividend on the DOW. Still costly at 37.31
One piece of advise is consistent among my 3 favorite books (Rule #1, Stan Weinstein's Secrets for Winning in Bull and Bear Markets, and The Little Book of Market Wizards) and the advice is to have patience.
Chief among the recommendations is to review the market on nights and weekends. Do not, I repeat DO NOT, watch the market all day. It will mess with your head!
Here are some of the nuggets I have found to be most helpful:
- Review stocks when the market is closed (nights or weekends).
- Don't watch quotes all day long because it can lead to over-trading.
- Resist the temptation to trade all the time.
- Don't trade on hunches. Have a system. See my prior post on using a checklist.
- Don't announce ideas to your friends because you will the become too attached to those ideas, lest you look like a fool.
- Doing nothing is harder than it sounds.
- Don't sell too early, stay with winners (let your winners run) and sell the losers.
- The trades not taken matter as they preserve capital.
My indicators continue show a Bear Market.
1 - 3. Major indexes vs. their 30 week moving averages. All three indexes have downward sloping 30 week moving averages and their close lines are still below the moving average.
4. Convergence of NYSE AD and DOW. Both moved down this week. Click here to see Barron's chart.
5. NYSE 200 day Moving Average.The NYSE is still well below its 200 day moving average.
6. NYSE 52 Weeks Highs vs. Lows. Any improvement from last week is gone.
7. NYSE 52 Week High Low vs. Dow Convergence/Divergence. Both down.
8. International Markets. The Global Dow is still way below its 30 week moving average.
9. Cost of a Dividend on the DOW. Still costly at 36.10
MACD - Technical Tool
One of the technical indicators covered in Phil Town's Rule #1 book is the MACD. MACD stands for Moving Average Convergence Divergence and is a tool to gauge momentum pressure. It uses 3 EMAs (exponential moving average); slow, fast and a trigger for crossing.
Investopedia has a nice explanation here:
Moving average convergence divergence (MACD) is a trend-following momentum indicator that shows the relationship between two moving averages of prices. The MACD is calculated by subtracting the 26-day exponential moving average (EMA) from the 12-day EMA. A nine-day EMA of the MACD, called the "signal line", is then plotted on top of the MACD, functioning as a trigger for buy and sell signals.
How to use the MACD
I use the MACD for buy and sell signals, along with my other tools. A buy signal is when the black line crosses above the red line, and likewise, a sell signal is when the red crosses the black line.
Let's look at the MACD on the weekly SPY (S&P ETF) using Chartmill. A sell signal was flashed in the May/June 2015 time frame, well before the August sell off. We had a buy signal flash in October of 2015 with a subsequent sell signal returning on January 2016.
As of this writing, the MACD is suggesting we stay out of the SPY. As the SPY can be viewed as a broad market indicator, it can also provide information on the market as a whole.
My indicators continue show a Bear Market.
1 - 3. Major indexes vs. their 30 week moving averages. All three indexes have downward sloping 30 week moving averages and their close lines are still below the moving average.
4. Convergence of NYSE AD and DOW. Both moved down this week. Click here to see Barron's chart.
5. NYSE 200 day Moving Average.The NYSE is still well below its 200 day moving average.
6. NYSE 52 Weeks Highs vs. Lows. Some improvement, but still more new lows than new highs.
7. NYSE 52 Week High Low vs. Dow Convergence/Divergence. The Dow moved down and the NYSE HILO moved up but not enough for me to consider it a positive sign as the NYSE is still in negative territory.
8. International Markets. The Global Dow is still way below its 30 week moving average.
9. Cost of a Dividend on the DOW. Still costly at 36.90


