Showing posts with label Dow. Show all posts

Saturday, July 8, 2023

Stock Market Update - Mid-Year 2023

We've just finished the first half of 2023 and I thought it might be a good time to take a look at how the market is doing. From a stage analysis perspective, we are in Stage 2 for the S&P and NASDAQ, the Dow however is in Stage 1.


We haven't looked at the CNN Fear and Greed indicator in awhile. We are currently in Extreme Greed.


Saturday, April 22, 2023

Stock Market Update - April 22, 2023 - Stage 1

 Most of the Weinstein indicators are in or moving to Stage 1. This stage can be rough, but at the moment appear to be in a multi-week stage 1. Here is a look at the DOW. The S&P and NASDAQ look similar.

Corporate earning reports are underway. 

Let's see what next week brings us.

Sunday, March 12, 2023

Stock Market Update - Back in the Negative

This week the DOW moved beneath it's 30 week moving average and the SPY and NASDAQ's 30 meek moving average reversed and is pointing down. Any hopes of moving into Stage 1 is squashed as we are again in Stage 4 decline. See previous post for Stage Analysis.

In addition Indicator 5: NYSE Advance-Decline 200 day moving average is touching the moving average line as shown below in this StockChart's graph.


The only index still positive is the Global DOW.

Some are pointing to the Silicon Valley Bank (SVB) Collapse as the main reason for last week's market downturn. Investors are watching to see if a bailout will take care of investors with deposits above the FDIC’s $250,000 cap. 

Never a dull moment.


Sunday, January 15, 2023

January 13 2023 - Stock Market Update

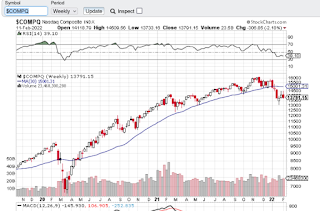
 Markets are performing a little better so far in 2023. The stage analysis indicators are moving into positive territory with the exception of the NASDAQ which has been affected by weakness in tech and the ups and downs of Tesla via Mr. Musk.

Let's take a look at some charts. The Dow may be entering into Stage 1 as shown below with the upturn of the 30 week moving average.


For the first time in over a year, Indicator #5 is positive. For this indicator, we look to see if the NYSE Advance-Decline (A-D) is above or below its 200 day moving average. The divergence between the advances and declines is plotted on a chart, and the 200 day moving average is also plotted.


At this point I am watching and gently buying shares of some stock that I think may be in for an upward climb.


Sunday, January 1, 2023

2022 Year in Review - Markets Tanked

 The year has been quite the ride! The entire year down. Here are the numbers according to this Market Watch article by William Watts.


  • S&P -19.4%
  • Dow -8.8%
  • NASDAQ -33.1%

Pretty painful year.

I love this chart published by Jill Mislinski over at Advisor Perspectives.


Happy New Year to 2023! Let's hope it is a year we start to recover our losses.

Cheers!

Sunday, December 11, 2022

Stock Market Update - December 10, 2022

 Stocks are starting to look a little bit better with some of the indicators getting poised for positivity. We're not there yet but at least there is some improvement. It's been a about a year for this market's downturn.

Green represents a glimmer of hope but doesn't make the indicator positive until the moving average line slopes up.

Indicators:

  1. DOW - 30 Week Moving Average Line flat, close above the line
  2. S&P - 30 Week Moving Average Line flat, close above the line
  3. NASDAQ - Below the line 
  4. Global DOW - 30 Week Moving Average Line flat, close above the line
  5. NYSE AD and DOW Convergence - Both down
  6. NYSE AD 200 Day Moving Average
  7. NYSE 52 Week Highs and Lows
 
 I am hopeful 2023 will be the year we turn the tide, until then let's watch the tape!

Sunday, November 13, 2022

Stocks Gain in Positivity - Is there hope?

 The last couple of weeks are showing some signs of hope for stocks. October had a big gain. I am hopeful we are beginning to see a turn around and then even better if we start to climb the wall of worry.

CNN's Fear and Greed Indicator is at Greed


The Finviz Heat Map for the last month is mostly green.


And finally, the Dow poked about its 30 week moving average line.


A cat can hope!


Sunday, February 20, 2022

Stock Market Update - Feb 18, 2022 - Gold approaching Dow

 Another bad week for stocks. One of the indicators I like to use is the Gold vs. Dow chart. At the moment, gold is approaching the Dow's moving average line.


Generally when gold prices rise and stock prices go down it is a sign of a bad market. 


Sunday, February 13, 2022

Stock Market Update - Feb 11, 2022 - Bear Market - Stage 4

Looking at the Stan Weinstein indicators, we are in a Bear Market. All indicators except for the Global Dow are negative. 

COVID cases are down and hopefully life returns to normal in 2022. So what is the problem? Inflation, Ukraine/Russia tension according to this Wall Street Journal article.

Tech, led by Facebook is taken a beating. FANG stocks are not looking too good. Apple is doing fine but the others are not.   The Apple vs Facebook battle over our data is an interesting one. 

Let's look at the charts. At this point, just a minor correction. We will have to wait and see if it stays minor or gets larger.


Sunday, January 16, 2022

Stock Market Update - January 14, 2022

 My indicators are mixed this week. Nothing too horrible, mostly minor showing of weakness in some indicators. The NASDAQ is below its 30 week moving average just a little bit, the NYSE had more lows than highs, and the NYSE/DJIA were both down.

One of my favorite charts, the Dow vs GLD, shows the Dow outperforming gold. I view this as a good sign.


Have you tried to buy a car lately? Used or new they are hard to come by. Dealer lots are empty. So empty in fact that they have used vehicles in the show room and dissuade you from buying used (where they usually make a nice profit) for fear they won't have any example of the model to show potential buyers. Wow.

What's the problem? A chip shortage. The US is looking to boost more manufacturing here.

How about groceries? Tried to buy any of those lately? Around here the veggies shelves are empty. My plan? Go to the local farmer's market. A good idea anyway. Lots of fresh veggies and not pesticides to boot!


Sunday, January 2, 2022

2021 Stock Market Year End Performance

 2021 was a good year for the market! In general up 20%. Not bad. Who would have thought a pandemic would be good for the stock market?

Here's how the major indexes performed:

  • S&P 26.9%
  • NasDaq 21.39%
  • DOW 18.73%
  • GLD -6.24%
  • XLE (Energy ETF) 17.54%
  • TIP (Treasury Inflation Protected Bonds) 1.10%
  • Bitcoin 46.65%

A few visuals to show the year.

S&P 


NASDAQ


DOW


BitCoin to US Dollar


Monday, December 6, 2021

It appears we may be headed for a correction. All of the indicators are red or about to turn red.

Let's look at the indicators.

  1. DJIA vs 30 week MA: Below
  2. S&P  vs 30 week MA:Touching
  3. Nasdaq vs 30 week MA:Touching
  4. Global DOW vs 30 week MA: Below
  5. DJIA vs NYSE A-D: Both Down
  6. Divergence: DJIA vs NYSE High/Low: Both Down
  7. 200 Day MA NYSE A-D:Touching
  8. NYSE  52 Wk Highs-Lows Diff: -182


Saturday, July 10, 2021

Stock Market Update: July 8, 2021

 From a stage analysis viewpoint, we are in Stage 2 Accumulation (see stage analysis overview here) with the market continuing to go up.

One of the gauges I like to look at is the Dow vs NYSE Advance-Decline. (Barron's used to produce it but stopped so I make my own chart.) It's a bad sign for the market when the Dow is advancing more than the NYSE, which we see in March of 2020 when COVID hit. Likewise, it's a positive sign when the NYSE is above the Dow. That's where we are now. It's one of the biggest divergences I've seen in a while.


Stories of interest:


Saturday, January 2, 2021

2020 End of Year Review

 Here is a quick breakdown of how 2020 fared for stocks.


  • Dow 9.7%
  • S&P 17.63%
  • NASDAQ 45%
  • GLD 23%
  • TIP 10%
  • SDS (Ultra short S&P) -48%


Not a good year for the DOW in comparison to the other indexes. Great year otherwise.


Sunday, September 13, 2020

Stock Market Update: September 11, 2020

This week saw a little pull back however from a long view of weekly and monthly charts, the major indexes are still above their 30 week moving averages. Gold continues to be above it's moving average as well, but could be entering into Stage 3. 

The DOW shuffled the companies. Out are ExxonMobile, Raytheon and Pfiezer. In are Salesforce, Amgen and Honeywell. Also impacting the DOW is the Apple 4 for 1 stock split.

Holding steady for now.


Monday, August 31, 2020

Stock Market Update: End of August 2020

 The market continues to move up. CNN's Fear and Greed indicator is reading greed.


I find this chart I came up with to be interesting. The Gold ETF, GLD, compared to the DOW price action. If you notice, gold went up prior to the big market decline in 2009.  I circled the cross overs however you can see the price action diverged between the two when there was a change in the market. At the moment both are on an uptrend. In my opinion, if a COVID-19 vaccine comes out, then gold will probably drop, at least temporarily. It could continue to hold steady though as governments around the world print money and the dollar keeps losing value.


Sunday, August 23, 2020

Stock Market Update Week Ending Aug 21, 2020 - NYSE vs Dow Trend Chart

The market remains mixed as posted last week.

This week I want to look at a chart from Stan's book that used to be available on the Barron's site but they have since retired it so I make my own. It is the Dow vs. the NYSE Advance-Decline ratio.  We are looking for changes in trend. If both the Dow and NYSE A-D are going in the same direction or are they diverging?

In January they diverted and it turned out to be a signal of the drop. This week we see a potential divergence. What is important to note is that defensive stocks are in favor when the Dow moves up but the NYSE A-D moves down. We need to see if this continues as one week does not make a trend. 

This indicator should not be used on its own.


Stockcharts S&P shows the S&P began decline in February.

Sunday, June 4, 2017

Weekly Stock Market Update: Full Steam Ahead

Stocks continue to advance and all indicators are green, with the exception of the dividend ratio on the Dow, but I think that indicator may need adjusting for the era we are in with low interest rates.

If we take a step back and look at the markets from a macro view and use the 10 month moving average (MA) compared to the 30 month exponential moving average (EMA) on each of the major indexes, we can see a nice picture of where we are. When the 30 EMA crosses over the 10 MA it is bad news, however it the shorter term MA is above the longer EMA, then it is good news. You can see we've been in good news territory for awhile. 

This can be a great tool to signal when to get out and when to get back in. Look at the circled cross overs in the chart of the DOW.


From an emotional perspective, it feels like we are in overbought territory, but until the indicators change, I am in.


Monday, December 14, 2015

Broad Market Indicator #4: NYSE Advance Decline (A-D) Line

The 4th Indicator is a comparison of the movement of the DOW (DJIA) to the Advance-Decline line of the NYSE. The NYSE A-D line measures the number of stocks advancing versus declining on a weekly basis. We are looking to see if the Dow and the NYSE A-D are moving in convergence or divergence. When the DOW goes up but the NYSE A-D line goes down, it is an indication that investors are moving into safer stocks (DOW) as the DOW tends to have blue-chip companies. 


Here is Barron's chart plotting the NYSE against the DOW. I added the red boxes to show where the DOW moved up while the NYSE AD moved down, ominous signs!

You can follow Barron's chart at this link.

You can see the breakdown signal that occurred in August prior to the latest market correction. We will need to wait and see if we are about to go back down again for a period of time.