Showing posts with label stage 4. Show all posts

Sunday, March 12, 2023

Stock Market Update - Back in the Negative

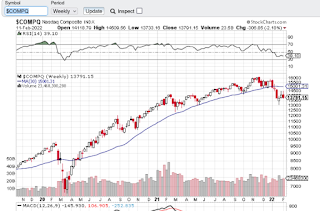
This week the DOW moved beneath it's 30 week moving average and the SPY and NASDAQ's 30 meek moving average reversed and is pointing down. Any hopes of moving into Stage 1 is squashed as we are again in Stage 4 decline. See previous post for Stage Analysis.

In addition Indicator 5: NYSE Advance-Decline 200 day moving average is touching the moving average line as shown below in this StockChart's graph.


The only index still positive is the Global DOW.

Some are pointing to the Silicon Valley Bank (SVB) Collapse as the main reason for last week's market downturn. Investors are watching to see if a bailout will take care of investors with deposits above the FDIC’s $250,000 cap. 

Never a dull moment.


Sunday, January 1, 2023

2022 Year in Review - Markets Tanked

 The year has been quite the ride! The entire year down. Here are the numbers according to this Market Watch article by William Watts.


  • S&P -19.4%
  • Dow -8.8%
  • NASDAQ -33.1%

Pretty painful year.

I love this chart published by Jill Mislinski over at Advisor Perspectives.


Happy New Year to 2023! Let's hope it is a year we start to recover our losses.

Cheers!

Saturday, October 15, 2022

Stock Market Update: Shorts vs Buyers SDS vs. SPX

 This week the market had a few days with big swings up and then back down again. A lot of action.

One comparison I like to do is to compare the short SPY ETF to the S&P index. As we can see below the last cross over occurred in September. The SDS is above the SPY signalling we have more short action than buying action. Not a good sign.

October can be a loss harvest month with the mutual funds and it's possible that is contributing to some of the downside. All indicators remain in the red.


Sunday, September 18, 2022

Saturday, August 27, 2022

Stocks Take a Tumble - Fed Chair Speech of Pain

 Just when it looked as though the market was starting to look up, with the big indexes moving above their 30 week moving average, Fed Chair Powell let it rip that we are in for more pain. Yikes!

As Mary Ellen McGonagle put's it "Fed Chair Powell's comments today that bringing down prices "is likely to require a sustained period of below-trend growth and an increase in unemployment" brought the markets to its knees."

My favorite chart is offered up by Jill Mislinski at Advisor Perspectives in this article


With all that, we are clearly still in Stage 4 decline. Here is a chart showing where we are on the S&P. Notice the 30 week moving average continues to slope down.


Sunday, June 26, 2022

Stock Market Bounce - June 24, 2022

This week we had a little bounce. Interestingly though, there were still more new lows than new highs in the NYSE.

Let's compare the 2008-2009 downturn in the NasDaq to our current downturn.


 2008 - 2009 crash - Long Period of time - about 1 year and 4 months


Current downturn in NasDaq - about 7 months so far.


We are obviously still in Stage 4 - downturn! Let's see what develops over the next few months.


Sunday, June 5, 2022

Stock Market Update - June 3, 2022

This week and the week prior, saw some stabilization on the downward trend we've been in since December 2021. All my indicators remain in the red however. We don't know if this is just a pause and we don't know which direction we will go from here. We are still in Stage 4 decline.

Looking at market sectors, the only well performing sectors for the last month are Energy, Utilities and Materials. Especially interesting is XLE which lagged the market recovery from COVID up until recently as it now outperforms the others. See this Stockcharts graph.


Saturday, May 14, 2022

Stock Market Update - Stage 4 Decline Continues

 Even with the little uptick on Friday, the overall week is down and we continue to be in Stage 4 Downturn. All indicators remain in the negative.

  • Stage 4 - Declining Phase
    • Close line below the 30 week Moving Average (MA)
    • 30 week Moving Average is sloping down


Inflation remains high, inventory of goods remains slow and sluggish, the Russian/Ukrainian war continues, COVID is still an issue, and CNN's Fear and Greed is at Extreme Fear.


Saturday, April 23, 2022

Stock Market Update - Continued Down Trend

 The markets continue to be in Stage 4 Decline. The sell-off while prolonged is not as deep as the last one that occurred in 2020. Tech is hardest hit this time around.


My friend Jimmy had recommended iBonds to me a few months ago. They are a great way to earn a high interest rate with some caveats. Including them in your portfolio helps balance out market downturns. With inflation going up they are about to increase to near 9% return.

To learn more read these articles:


Sunday, April 3, 2022

Stock Market Update - April Fool's 2022

 This week saw a little bounce, but the major indexes have not broken above their 30 week moving average lines.

Wishing Wealth feels this could be a bad sign. Too many breakouts not making it.

Jill Mislinski at Advisors Perspectives is showing mixed signals with the S&P analysis signaling to be in cash, however, the longer view of the Ivy Portfolios are a mix of cash and invested.

CNN's Fear and Greed has moved up a bit. It had been in the dumps for weeks.


We shall wait and see.

Sunday, March 20, 2022

Stock Market Update - March 18, 2022 - Little Bounce

We are still in Stage 4 decline, however all 3 indexes did have a nice uptrend for the week.

One indicator to keep an eye on is the Dow vs Gold. They are about to cross. If they do indeed cross, then I view that as a sign of trouble. As of the end of this week, the bad trend reverted with gold dipping down. See this stockcharts link.

The government in contemplating an end to Daylight Savings - please let it be so!

The Sunshine Protection Act has passed the Senate and is awaiting House review.

Unfortunately the war in Ukraine continues.


Sunday, March 6, 2022

Stock Marrket Update - Stage 4 - Stormy Weather

No doubt about it, we are in Stage 4 downtrend. All of my indicators are in the red. The last one to go red is the global DOW which is now below its 30 week moving average.

Another indicator to watch is the 10 week moving average vs the 30 week moving average. The cross has occurred with the NASDAQ taking the most heat.  

The Russian invasion of Ukraine is sadly a driver, along with inflation (gas prices anyone?), and supply chain issues. For once, COVID is not behind the bad news as most states lift their mask mandates and hopefully we return back to normal.


CNN's Fear and Greed indicator is at the lowest I've seen in a long time.


Sunday, February 13, 2022

Stock Market Update - Feb 11, 2022 - Bear Market - Stage 4

Looking at the Stan Weinstein indicators, we are in a Bear Market. All indicators except for the Global Dow are negative. 

COVID cases are down and hopefully life returns to normal in 2022. So what is the problem? Inflation, Ukraine/Russia tension according to this Wall Street Journal article.

Tech, led by Facebook is taken a beating. FANG stocks are not looking too good. Apple is doing fine but the others are not.   The Apple vs Facebook battle over our data is an interesting one. 

Let's look at the charts. At this point, just a minor correction. We will have to wait and see if it stays minor or gets larger.


Saturday, January 29, 2022

Stock Market Update - January 28, 2022

 We are in a bit of a correction. The NasDaq is now in Stage 4 decline because its 30 week moving average line is now sloping downward.


The other major indexes are in Stage 3 and possibly heading for Stage 4.

One of my favorite Stan Weinstein indicators is to chart the difference between NYSE stocks hitting their 52 week high vs those hitting their 52 week low. He said not to use it alone but in conjunction with the other indicators. If we take a look at it now, it shows that we are in the beginning of a correction. How far it goes is hard to say, this could be a normal correction or if tensions continue with Russia, inflation doesn't budge and if there are more restrictions due to COVID which is also driving inflation, then it could continue. Hard to say. 


Saturday, February 27, 2021

COVID news of late has been more positive with hospitalization rates going down and the vaccine being administered. I have hopes of a recovery in late 2021  and into 2022.  The Atlantic has a great story about the importance of fresh air in treating airborne illnesses and how in the early part of COVID we forgot or discounted some of the measures learned during the 1918 pandemic.  See "We're Just Rediscovering a 19th Century Pandemic Strategy".

If you've ever worked in a modern office building you will appreciate the story. They are often stuffy with little air circulation and the windows don't open. I hate them. Add to that nobody can agree on the proper temperature. Often the ventilation systems are inadequate or under powered to save money.

The Market is still doing well from a stage analysis at this time. Gold appears to be entering in to stage 4.  My bets are on energy, travel stocks, and other areas that will benefit from some sort of 'back to normalcy'.


Sunday, June 28, 2020

Stock Market Update: June 28, 2020

Market indicators are mixed. The recent upturn appears to be on shaky ground with Nassim Taleb calling for hedging a long tail. 

With that in mind, let's see where gold is from a stage perspective using the GLD ETF via stockcharts.

The moving average is sloping up, the close is above the 30 week moving average and fundamentals for gold are improving if you consider that it is widely viewed as a hedge for the market. The chart below shows the peak of gold during the 2009 market downturn was around $180. Current prices is $162. If we consider 180 to be the ceiling then we may have room for higher prices.


How about looking at the tech sector? The NasDaq continues to be in a stage 2 accumulation phase.


Overall, the market is choppy however, and that indicates we are still in phase 4 overall. The DOW and S&P are not in stage 2 but are still in stage 4.
 

Sunday, June 7, 2020

Stock Market Update: Week Ending June 5, 2020

Big rebound in markets this week with an upbeat jobs report.

From a stage analysis perspective, we have the following:
  • DOW & S&P : Stage 4. The 30 week moving average is still sloping down or is flat.
  • NASDAQ: Stage 1: Closing price above the 30 week moving average and the moving average is sloping upward
 The CNN Fear and Greed index is showing a little bit of improvement the first time a long time.


Many areas in the US are re-opening in phases and fingers crossed, we can re-open without a resurgence in cases. We all need to get out of the house!!  
 

Monday, May 25, 2020

Stock Market Update: Week Ending May 22, 2020

Markets are mixed. There are signs of hope as states start to reopen. The Wall Street Journal has a nice map.


Many are limiting gatherings to 10 people or less. It would be nice to see a little more flexibility in some of the restrictions. If a wine store can be an 'essential' business and allow foot traffic, then you would think some additional retail stores could also be open with managed foot traffic. We want our small businesses to stay open and functioning, they are the backbone of our towns.


The NASDAG continues to be in a Stage 1 uptrend, while the S&P and DOW remain in Stage 4 decline. GLD appears to be strongly in Phase 2.


Sunday, May 17, 2020

Stock Market Update - Week Ending May 15, 2020

From a stage analysis perspective, the market continues to be in Stage 4.
The NASDAQ continues to be in a stage 1, but the other indexes are in stage 4.


The CDC map for the week


Stay at home orders map from Business Insider.


Sunday, May 3, 2020

Stock Market Update: End of April 2020

The market is on a wild ride, swinging from positivity to negativity with wide ranges. The DOW and S&P are in stage 4, the NASDAQ is in a possible stage 1.


COVID-19 continues to dominate the world. States in the US are beginning to plan re-opening business. Here is this week's COVID map. Note the new color purple used to designate cases above 28,764. 


Caution with stocks is recommended as we still in a stage 4 and the candlesticks in the charts above show wild swings in stock price movements.