Showing posts with label NASDAQ. Show all posts

Monday, January 1, 2024

2023 Stock Market Performance Wrap Up

2023 was a great year for the stock market. We finally saw some improvements after the long sideways performance of 2022. 

  • S&P - up 26%
  • Dow - up 13%
  • NASDAG - up 53%

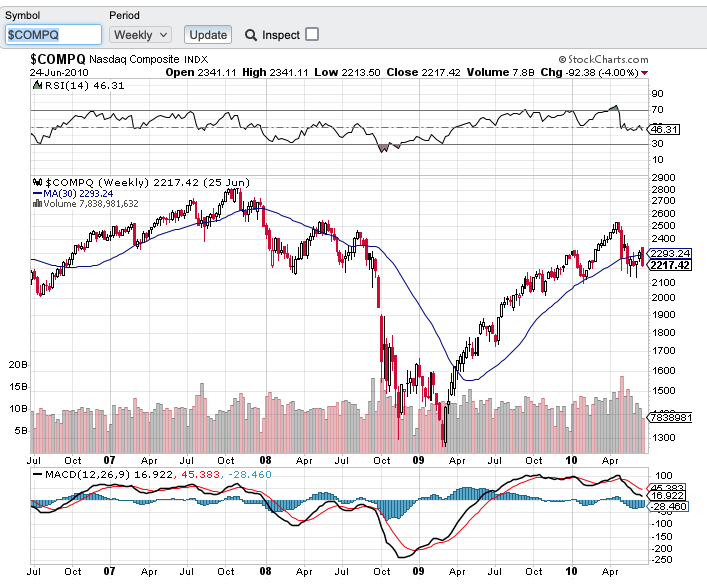
We appear to be in Stage 2 going into 2024 which is a positive sign. A review of Stage 2. This is a time to invest.

  • Stage 2 - Advancing Phase
    • 30 week moving average slopes up. 
    • Close is above the 30 week Moving Average, with higher lows
    • Fundamentals improve


Slickcharts has some fantastic charts. Here is one showing returns year over year for the S&P.


Saturday, July 8, 2023

Stock Market Update - Mid-Year 2023

We've just finished the first half of 2023 and I thought it might be a good time to take a look at how the market is doing. From a stage analysis perspective, we are in Stage 2 for the S&P and NASDAQ, the Dow however is in Stage 1.


We haven't looked at the CNN Fear and Greed indicator in awhile. We are currently in Extreme Greed.


Sunday, March 12, 2023

Stock Market Update - Back in the Negative

This week the DOW moved beneath it's 30 week moving average and the SPY and NASDAQ's 30 meek moving average reversed and is pointing down. Any hopes of moving into Stage 1 is squashed as we are again in Stage 4 decline. See previous post for Stage Analysis.

In addition Indicator 5: NYSE Advance-Decline 200 day moving average is touching the moving average line as shown below in this StockChart's graph.


The only index still positive is the Global DOW.

Some are pointing to the Silicon Valley Bank (SVB) Collapse as the main reason for last week's market downturn. Investors are watching to see if a bailout will take care of investors with deposits above the FDIC’s $250,000 cap. 

Never a dull moment.


Sunday, January 15, 2023

January 13 2023 - Stock Market Update

 Markets are performing a little better so far in 2023. The stage analysis indicators are moving into positive territory with the exception of the NASDAQ which has been affected by weakness in tech and the ups and downs of Tesla via Mr. Musk.

Let's take a look at some charts. The Dow may be entering into Stage 1 as shown below with the upturn of the 30 week moving average.


For the first time in over a year, Indicator #5 is positive. For this indicator, we look to see if the NYSE Advance-Decline (A-D) is above or below its 200 day moving average. The divergence between the advances and declines is plotted on a chart, and the 200 day moving average is also plotted.


At this point I am watching and gently buying shares of some stock that I think may be in for an upward climb.


Sunday, January 1, 2023

2022 Year in Review - Markets Tanked

 The year has been quite the ride! The entire year down. Here are the numbers according to this Market Watch article by William Watts.


  • S&P -19.4%
  • Dow -8.8%
  • NASDAQ -33.1%

Pretty painful year.

I love this chart published by Jill Mislinski over at Advisor Perspectives.


Happy New Year to 2023! Let's hope it is a year we start to recover our losses.

Cheers!

Sunday, December 11, 2022

Stock Market Update - December 10, 2022

 Stocks are starting to look a little bit better with some of the indicators getting poised for positivity. We're not there yet but at least there is some improvement. It's been a about a year for this market's downturn.

Green represents a glimmer of hope but doesn't make the indicator positive until the moving average line slopes up.

Indicators:

  1. DOW - 30 Week Moving Average Line flat, close above the line
  2. S&P - 30 Week Moving Average Line flat, close above the line
  3. NASDAQ - Below the line 
  4. Global DOW - 30 Week Moving Average Line flat, close above the line
  5. NYSE AD and DOW Convergence - Both down
  6. NYSE AD 200 Day Moving Average
  7. NYSE 52 Week Highs and Lows
 
 I am hopeful 2023 will be the year we turn the tide, until then let's watch the tape!

Sunday, June 26, 2022

Stock Market Bounce - June 24, 2022

This week we had a little bounce. Interestingly though, there were still more new lows than new highs in the NYSE.

Let's compare the 2008-2009 downturn in the NasDaq to our current downturn.


 2008 - 2009 crash - Long Period of time - about 1 year and 4 months


Current downturn in NasDaq - about 7 months so far.


We are obviously still in Stage 4 - downturn! Let's see what develops over the next few months.


Sunday, March 6, 2022

Stock Marrket Update - Stage 4 - Stormy Weather

No doubt about it, we are in Stage 4 downtrend. All of my indicators are in the red. The last one to go red is the global DOW which is now below its 30 week moving average.

Another indicator to watch is the 10 week moving average vs the 30 week moving average. The cross has occurred with the NASDAQ taking the most heat.  

The Russian invasion of Ukraine is sadly a driver, along with inflation (gas prices anyone?), and supply chain issues. For once, COVID is not behind the bad news as most states lift their mask mandates and hopefully we return back to normal.


CNN's Fear and Greed indicator is at the lowest I've seen in a long time.


Sunday, February 13, 2022

Stock Market Update - Feb 11, 2022 - Bear Market - Stage 4

Looking at the Stan Weinstein indicators, we are in a Bear Market. All indicators except for the Global Dow are negative. 

COVID cases are down and hopefully life returns to normal in 2022. So what is the problem? Inflation, Ukraine/Russia tension according to this Wall Street Journal article.

Tech, led by Facebook is taken a beating. FANG stocks are not looking too good. Apple is doing fine but the others are not.   The Apple vs Facebook battle over our data is an interesting one. 

Let's look at the charts. At this point, just a minor correction. We will have to wait and see if it stays minor or gets larger.


Saturday, January 29, 2022

Stock Market Update - January 28, 2022

 We are in a bit of a correction. The NasDaq is now in Stage 4 decline because its 30 week moving average line is now sloping downward.


The other major indexes are in Stage 3 and possibly heading for Stage 4.

One of my favorite Stan Weinstein indicators is to chart the difference between NYSE stocks hitting their 52 week high vs those hitting their 52 week low. He said not to use it alone but in conjunction with the other indicators. If we take a look at it now, it shows that we are in the beginning of a correction. How far it goes is hard to say, this could be a normal correction or if tensions continue with Russia, inflation doesn't budge and if there are more restrictions due to COVID which is also driving inflation, then it could continue. Hard to say. 


Sunday, January 23, 2022

Stock Market Update - January 21, 2022 - Signals Down

 From my perspective, we are now entering into Stage 3 for the major indexes, all of which are now below their 30 week moving averages. At this point, the moving average line is slightly up or flat, it is not going down into Stage 4. Interestingly, the global Dow is above. Generally it lags the US markets but not this time.


  • Broad indexes except GDOW are below their 30 week moving averages 
  • DJIA vs NYSE A-D: Both Down
  • Divergence: DJIA vs NYSE High/Low: Both Down
  • 200 Day MA NYSE A-D: Below the line for the first time in a long time
  • NYSE  52 Wk Highs-Lows Diff: -519 meaning more stocks were at their lows

Tech took the biggest hit this week.


Sunday, January 16, 2022

Stock Market Update - January 14, 2022

 My indicators are mixed this week. Nothing too horrible, mostly minor showing of weakness in some indicators. The NASDAQ is below its 30 week moving average just a little bit, the NYSE had more lows than highs, and the NYSE/DJIA were both down.

One of my favorite charts, the Dow vs GLD, shows the Dow outperforming gold. I view this as a good sign.


Have you tried to buy a car lately? Used or new they are hard to come by. Dealer lots are empty. So empty in fact that they have used vehicles in the show room and dissuade you from buying used (where they usually make a nice profit) for fear they won't have any example of the model to show potential buyers. Wow.

What's the problem? A chip shortage. The US is looking to boost more manufacturing here.

How about groceries? Tried to buy any of those lately? Around here the veggies shelves are empty. My plan? Go to the local farmer's market. A good idea anyway. Lots of fresh veggies and not pesticides to boot!


Sunday, January 2, 2022

2021 Stock Market Year End Performance

 2021 was a good year for the market! In general up 20%. Not bad. Who would have thought a pandemic would be good for the stock market?

Here's how the major indexes performed:

  • S&P 26.9%
  • NasDaq 21.39%
  • DOW 18.73%
  • GLD -6.24%
  • XLE (Energy ETF) 17.54%
  • TIP (Treasury Inflation Protected Bonds) 1.10%
  • Bitcoin 46.65%

A few visuals to show the year.

S&P 


NASDAQ


DOW


BitCoin to US Dollar


Monday, July 5, 2021

Mid-Year Performance Review - July 5, 2021

Let's look at how the market is performing so far this year. It's been a good year so far.

  • DOW:       +13.66%
  • S&P:        +15.87
  • NASDAQ: +13.59
  • GLD:        -6.21

If we look at the charts going back to September 2020, we can see visually how things are progressing.


 Be cautious a pull back may be in order. We are in interesting times!