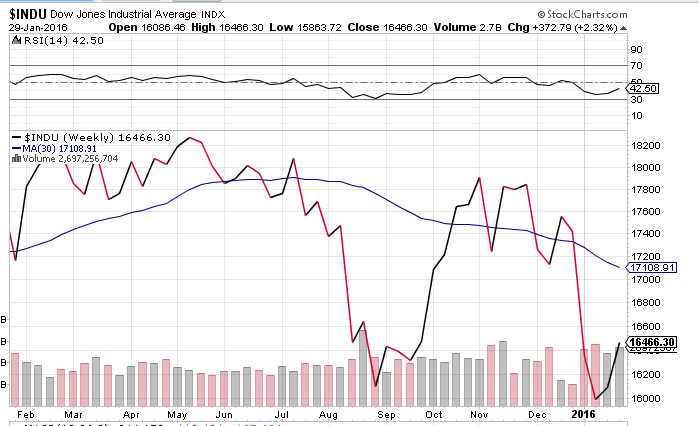
My indicators show a Bear Market.
1 - 3. Major indexes vs. their 30 week moving averages. All three indexes have downward sloping 30 week moving averages and their close lines are still below the moving average.
4. Convergence of NYSE AD and DOW. Both moved up a nicely this week. Click here to see Barron's chart.
5. NYSE 200 day Moving Average.The NYSE is still well below its 200 day moving average.
6. NYSE 52 Weeks Highs vs. Lows. Some improvement, but still more new lows than new highs.
7. NYSE 52 Week High Low vs. Dow Convergence/Divergence. Both the and the NYSE HILO moved up.
8. International Markets. The Global Dow is still way below its 30 week moving average.
9. Cost of a Dividend on the DOW. Still costly at 37.45
While in a bear market, there will be days when a market rebound appears. The news will be all over it and might even declare the end of a bear market. That’s why it is important to look at data yourself and develop your own opinion on where the market is. The weekly indicators are used for the purpose of determining the market trend and help me keep a steady mind. Paying attention to stock news sites can be a wild ride.
I learned the hard way to develop a checklist for my trades. Following recommendations made by others always seems to get me into hot water. I think it’s because I don’t have the volition to stick with a stock I haven't researched myself. I need to believe in my decisions.
Here is what I have in my current checklist. I find it helps me take emotions out of the buying and selling a stock. During down markets like this, I will often review past trades to see if my checklist should be modified or updated.
Learning from past mistakes is very helpful!
This week ended with two days of a positive closes on the major indices, however, when we look at it from a broad view, we are clearly not out of hot water yet. My indicators show a Bear Market.
1 - 3. Major indexes vs. their 30 week moving averages. All three indexes blew down past their 30 week moving averages.
4. Convergence of NYSE AD and DOW. Both moved up a little this week. Click here to see Barron's chart.
5. NYSE 200 day Moving Average.The NYSE is still well below its 200 day moving average.
6. NYSE 52 Weeks Highs vs. Lows. This is a very telling chart. More new lows than new highs.
7. NYSE 52 Week High Low vs. Dow Convergence/Divergence. The Dow moved up, while the NYSE HILO moved down. Not a positive signal.
8. International Markets. The global dow is well below its 30 week moving average.
9. Cost of a Dividend on the DOW. Still costly at 36.63.
Stan Weintstein's book "Secrets for Profiting in Bull and Bear Markets", relies heavily on Stage Analysis, a method of evaluating a stock and/or an index in terms of accumulation (buying or selling). Using the Stage Analysis model there are four (4) distinct stages every stock and market goes through. I believe we entered Stage 4 in August and remember, I don't buy in Stage 4 because I don't know when it will end.
Stage Analysis:
- Stage 1 - Basing Phase (February 2012)
- 30 week moving average loses its downward slope and starts to improve
- Stage 2 - Advancing Phase (January 2013)
- 30 week moving average slopes up.
- Close is above the 30 week moving average, with higher lows
- Fundamentals improve
- Stage 3 - The Top Phase (May 2015)
- Loses momentum
- Choppy market
- 30 week moving average loses upward slope and flattens
- Stage 4 - Declining Phase (August 2015)
- Close line below Moving average
- 30 week moving average is sloping down
No surprise here! All indicators are firmly negative. I remain on the sidelines.
1 - 3. Major indexes vs. their 30 week moving averages. All three indexes blew down past their 30 week moving averages.
4. Convergence of NYSE AD and DOW. Both moved down this week. Click here to see Barron's chart.
5. NYSE 200 day Moving Average.The NYSE dropped well below its 200 day moving average.
7. NYSE 52 Week High Low vs. Dow Convergence/Divergence. This
week the NYSE 52 Week High/Low Differential was down (see above chart
in #6) and the Dow moved Down (see #1). Both agree in the downward
direction.
8. International Markets. The Global Dow is still way below its 30 week moving average.
9. Cost of a Dividend on the DOW. Still costly at 36.36.
This week ended down with all 9 indicators in the dumps. As a refresher, the reason we look at the 9 indicators is to get a sense of the overall market direction. If they are all flashing down like they are this week, then we know this is not a good time to buy new stocks for a trade (shorter duration of holding the stock) because it is very possible the market will go down further.
I am staying on the sidelines with my discretionary stock money but continuing to do my monthly investing in long term mutual funds. Long term, as in I won't need the money for many years and therefore will take advantage of dollar cost averaging in a down market.
1 - 3. Major indexes vs. their 30 week moving averages. All three indexes blew down past their 30 week moving averages.
4. Convergence of NYSE AD and DOW. Both moved down this week. Click here to see Barron's chart.
5. NYSE 200 day Moving Average.The NYSE dropped well below its 200 day moving average.
6. NYSE 52 Week High vs. Lows. We have a pretty solid streak of more new lows than highs. This pattern has been in place for at least 6 months and shows weakness in the market.
7. NYSE 52 Week High Low vs. Dow Convergence/Divergence. This week the NYSE 52 Week High/Low Differential was down (see above chart in #6) and the Dow moved Down (see #1). Both agree in the downward direction.
8. International Markets. The Global Dow is still way below its 30 week moving average.
9. Cost of a Dividend on the DOW. Still costly at 37.
This indicator measures what it costs to buy a dollar’s worth of
dividend. It is a very long indicator and could signal action a year in
advance. Do not use this indicator alone! Combine it with the others.
How to calculate:
- Obtain the current yield on the DJIA
- Get the DJIA close number for the week.
- Multiply the results of #1 and #2.
- Divide by the close #.
So the formula is simple and looks like this:
(“DJIA Yield” x “DJIA Close” ) / “DJIA Close”.
For the week ending 01/01/2016, the result is 39.22 and is considered overvalued.
Here’s how we get there (2.55% x 17425)/ 17265 = 39.37
I use Barron’s site to get my data at this link.
Here is a chart to illustrate the valuation metrics.
| Price/ Dividend Ratio |
Resulting Interpretation |
| 14 to 17 |
Bargain |
| 26 to 29 |
Dangerous |
| Above 29 |
Extremely Overvalued |
Cheers to the end of 2015 which ended down (Dow -2.2%, NYSE - 6.4%, S&P -.7%) with the exception of the NasDaq which ended the year with a 5.7% gain.
Look at this chart off Google Finance and you can see the indexes moved in concert to each other however, the Nasdaq won the race.
The weekly indicators for the last week of the year are showing continued weakness. Those that had improvement last week popped back down this week. I continue to remain on the sidelines and wait to see what 2016 will bring us!
1 - 3. Major indexes vs. their 30 week moving averages.The trend is still down even if they are slightly above their moving average line, it is a weak showing and note the moving average lines are sloping down, not up.
4. Convergence of NYSE AD and DOW. Both moved down this week.
5. NYSE 200 day Moving Average. This indicator was up for a bit, but moved underneath its moving average this week.
6. NYSE 52 Week High vs. Lows. This indicator popped up this week, but we need more than one week to make a trend.
7. NYSE 52 Week High Low vs. Dow Convergence/Divergence. This week the NYSE eeked out a positive differential (see above chart in #6), while the Dow moved Down (see #1). This is can be a positive signal but this week the change is small and note the overall trend is is weak.
8. International Markets. The Global Dow is still way below its 30 week moving average.
9. Cost of a Dividend on the DOW. Still costly at 39.22
That wraps it up! I am patiently sitting on the sidelines. This is a good time to scout out potential new stocks and to get some reading in. Happy New Year!