Showing posts with label SPY. Show all posts

Monday, January 1, 2024

2023 Stock Market Performance Wrap Up

2023 was a great year for the stock market. We finally saw some improvements after the long sideways performance of 2022. 

  • S&P - up 26%
  • Dow - up 13%
  • NASDAG - up 53%

We appear to be in Stage 2 going into 2024 which is a positive sign. A review of Stage 2. This is a time to invest.

  • Stage 2 - Advancing Phase
    • 30 week moving average slopes up. 
    • Close is above the 30 week Moving Average, with higher lows
    • Fundamentals improve


Slickcharts has some fantastic charts. Here is one showing returns year over year for the S&P.


Sunday, September 24, 2023

Stock Market Update - September 24, 2023

 The promising look to the market in the last few months, specifically, Stage 1, appears to be heading in the opposite direction. Almost all the indicators are about to turn red.

Here is a look at a couple of charts.

Indicators 1 - 3 - 30 Week Moving Averages

All are approaching their 30 week moving average lines.

The Dow Chart


The S&P Chart


Indicator 5: NYSE A-D 200 Day MA

NYSE Advance-Decline’s 200 days moving average to see if it is above (bull) or below (bear). We could be about to go into bear territory.


Be wary. October is coming up and sometimes it is a rough month!


Saturday, July 8, 2023

Stock Market Update - Mid-Year 2023

We've just finished the first half of 2023 and I thought it might be a good time to take a look at how the market is doing. From a stage analysis perspective, we are in Stage 2 for the S&P and NASDAQ, the Dow however is in Stage 1.


We haven't looked at the CNN Fear and Greed indicator in awhile. We are currently in Extreme Greed.


Sunday, January 1, 2023

2022 Year in Review - Markets Tanked

 The year has been quite the ride! The entire year down. Here are the numbers according to this Market Watch article by William Watts.


  • S&P -19.4%
  • Dow -8.8%
  • NASDAQ -33.1%

Pretty painful year.

I love this chart published by Jill Mislinski over at Advisor Perspectives.


Happy New Year to 2023! Let's hope it is a year we start to recover our losses.

Cheers!

Sunday, December 11, 2022

Stock Market Update - December 10, 2022

 Stocks are starting to look a little bit better with some of the indicators getting poised for positivity. We're not there yet but at least there is some improvement. It's been a about a year for this market's downturn.

Green represents a glimmer of hope but doesn't make the indicator positive until the moving average line slopes up.

Indicators:

  1. DOW - 30 Week Moving Average Line flat, close above the line
  2. S&P - 30 Week Moving Average Line flat, close above the line
  3. NASDAQ - Below the line 
  4. Global DOW - 30 Week Moving Average Line flat, close above the line
  5. NYSE AD and DOW Convergence - Both down
  6. NYSE AD 200 Day Moving Average
  7. NYSE 52 Week Highs and Lows
 
 I am hopeful 2023 will be the year we turn the tide, until then let's watch the tape!

Saturday, October 15, 2022

Stock Market Update: Shorts vs Buyers SDS vs. SPX

 This week the market had a few days with big swings up and then back down again. A lot of action.

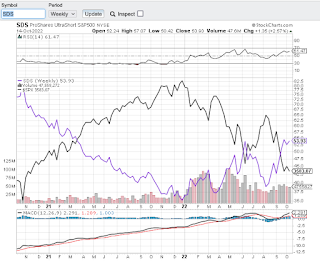
One comparison I like to do is to compare the short SPY ETF to the S&P index. As we can see below the last cross over occurred in September. The SDS is above the SPY signalling we have more short action than buying action. Not a good sign.

October can be a loss harvest month with the mutual funds and it's possible that is contributing to some of the downside. All indicators remain in the red.


Saturday, April 23, 2022

Stock Market Update - Continued Down Trend

 The markets continue to be in Stage 4 Decline. The sell-off while prolonged is not as deep as the last one that occurred in 2020. Tech is hardest hit this time around.


My friend Jimmy had recommended iBonds to me a few months ago. They are a great way to earn a high interest rate with some caveats. Including them in your portfolio helps balance out market downturns. With inflation going up they are about to increase to near 9% return.

To learn more read these articles:


Sunday, February 13, 2022

Stock Market Update - Feb 11, 2022 - Bear Market - Stage 4

Looking at the Stan Weinstein indicators, we are in a Bear Market. All indicators except for the Global Dow are negative. 

COVID cases are down and hopefully life returns to normal in 2022. So what is the problem? Inflation, Ukraine/Russia tension according to this Wall Street Journal article.

Tech, led by Facebook is taken a beating. FANG stocks are not looking too good. Apple is doing fine but the others are not.   The Apple vs Facebook battle over our data is an interesting one. 

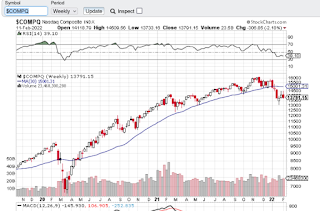
Let's look at the charts. At this point, just a minor correction. We will have to wait and see if it stays minor or gets larger.


Sunday, December 26, 2021

Stock Market Update - December 24, 2021

 The stage indicators this week turned green. Santa Clause rallied to bring them up.

Tech via the NasDaq took a bit of a hit in the last couple of weeks, but the 30 week moving average is still sloping upward which keeps us in stage 2.


If we look at gold versus the S&P we see gold is below the S&P. I read that as a positive indicator.


Merry Christmas!


Sunday, August 22, 2021

Stock Market Update: August 20, 2021 - Bad News Week

This past week was a downer, it just seemed the bad news wouldn't stop. Delta variants, Afghanistan pull out blunder, and tropical storm Henri! Maybe it's just me, but I am getting tired.

Tropical Storm Henri


COVID Cases


From a stage analysis point of view, things appear to be okay. Some of the indexes are flirting with their 30 week moving average lines, but are still above the line.


Interesting bitcoin news:

https://news.bitcoin.com/jpmorgan-wells-fargo-launching-bitcoin-funds-sec-filings/ 

Monday, July 5, 2021

Mid-Year Performance Review - July 5, 2021

Let's look at how the market is performing so far this year. It's been a good year so far.

  • DOW:       +13.66%
  • S&P:        +15.87
  • NASDAQ: +13.59
  • GLD:        -6.21

If we look at the charts going back to September 2020, we can see visually how things are progressing.


 Be cautious a pull back may be in order. We are in interesting times!


Saturday, January 2, 2021

2020 End of Year Review

 Here is a quick breakdown of how 2020 fared for stocks.


  • Dow 9.7%
  • S&P 17.63%
  • NASDAQ 45%
  • GLD 23%
  • TIP 10%
  • SDS (Ultra short S&P) -48%


Not a good year for the DOW in comparison to the other indexes. Great year otherwise.


Sunday, September 27, 2020

Stock Market Update: September 25, 2020

There is a lot of uncertainty in the air. We have the upcoming election, talks of fast tracking a COVID-19 vaccine, and in general malaise and people are sick and tired of the lock down. 

The major indexes are above their 30 week moving averages however they are not looking to be in good shape as evidenced by the S&P chart below.


Gold appears to be consolidating. Its moving average line is still sloping up however which is a positive indicator.

I am in a wait and see mode at the moment and expect some turbulence with the election.

Sunday, August 23, 2020

Stock Market Update Week Ending Aug 21, 2020 - NYSE vs Dow Trend Chart

The market remains mixed as posted last week.

This week I want to look at a chart from Stan's book that used to be available on the Barron's site but they have since retired it so I make my own. It is the Dow vs. the NYSE Advance-Decline ratio.  We are looking for changes in trend. If both the Dow and NYSE A-D are going in the same direction or are they diverging?

In January they diverted and it turned out to be a signal of the drop. This week we see a potential divergence. What is important to note is that defensive stocks are in favor when the Dow moves up but the NYSE A-D moves down. We need to see if this continues as one week does not make a trend. 

This indicator should not be used on its own.


Stockcharts S&P shows the S&P began decline in February.

Sunday, July 19, 2020

Stock Market Update: July 17, 2020 - Let's Look at Gold

Stocks are doing well from a Stage Analysis view, with the DOW joining the other major indexes when it finally move above its 30 week moving average. Let's see if it sticks.

Gold has been getting a lot of attention lately as it reaches highs lately and the US government printing money like crazy. See this interesting Barron's Article.

I thought it would be interesting to compare gold to the DOW and S&P. If the recent crossover is any indication and works like it did in the 2009 downturn, gold may continue to move upwards. The orange line in each chart represents GLD (ETF).


How about technology? It also is on an upward trend. Martin Pring has a great blog post on it. The next coming week's will help us see if the trend will continue or reverse.


Sunday, July 12, 2020

Stock Market Update: July 11, 2020

The market continues to prove itself fairly resilient. Some say it is related to the fed policy. Technology has benefited from the work from home and stay at home mandates in reaction to the COVID pandemic. 

If the SDS ETF which is a hyper short vehicle is any indication, the markets are okay for now.  In the 2009 crisis, shorts were an indicator of how the market was doing. 


Here is a snapshot of how many COVID cases the US has as of this week.
and a comparison to the flu season:


We are living in interesting times indeed.