Sunday, January 1, 2023

2022 Year in Review - Markets Tanked

 The year has been quite the ride! The entire year down. Here are the numbers according to this Market Watch article by William Watts.


  • S&P -19.4%
  • Dow -8.8%
  • NASDAQ -33.1%

Pretty painful year.

I love this chart published by Jill Mislinski over at Advisor Perspectives.


Happy New Year to 2023! Let's hope it is a year we start to recover our losses.

Cheers!

Sunday, December 11, 2022

Stock Market Update - December 10, 2022

 Stocks are starting to look a little bit better with some of the indicators getting poised for positivity. We're not there yet but at least there is some improvement. It's been a about a year for this market's downturn.

Green represents a glimmer of hope but doesn't make the indicator positive until the moving average line slopes up.

Indicators:

  1. DOW - 30 Week Moving Average Line flat, close above the line
  2. S&P - 30 Week Moving Average Line flat, close above the line
  3. NASDAQ - Below the line 
  4. Global DOW - 30 Week Moving Average Line flat, close above the line
  5. NYSE AD and DOW Convergence - Both down
  6. NYSE AD 200 Day Moving Average
  7. NYSE 52 Week Highs and Lows
 
 I am hopeful 2023 will be the year we turn the tide, until then let's watch the tape!

Sunday, November 13, 2022

Stocks Gain in Positivity - Is there hope?

 The last couple of weeks are showing some signs of hope for stocks. October had a big gain. I am hopeful we are beginning to see a turn around and then even better if we start to climb the wall of worry.

CNN's Fear and Greed Indicator is at Greed


The Finviz Heat Map for the last month is mostly green.


And finally, the Dow poked about its 30 week moving average line.


A cat can hope!


Saturday, October 15, 2022

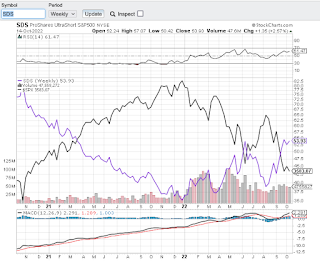
Stock Market Update: Shorts vs Buyers SDS vs. SPX

 This week the market had a few days with big swings up and then back down again. A lot of action.

One comparison I like to do is to compare the short SPY ETF to the S&P index. As we can see below the last cross over occurred in September. The SDS is above the SPY signalling we have more short action than buying action. Not a good sign.

October can be a loss harvest month with the mutual funds and it's possible that is contributing to some of the downside. All indicators remain in the red.


Sunday, September 18, 2022

Saturday, August 27, 2022

Stocks Take a Tumble - Fed Chair Speech of Pain

 Just when it looked as though the market was starting to look up, with the big indexes moving above their 30 week moving average, Fed Chair Powell let it rip that we are in for more pain. Yikes!

As Mary Ellen McGonagle put's it "Fed Chair Powell's comments today that bringing down prices "is likely to require a sustained period of below-trend growth and an increase in unemployment" brought the markets to its knees."

My favorite chart is offered up by Jill Mislinski at Advisor Perspectives in this article


With all that, we are clearly still in Stage 4 decline. Here is a chart showing where we are on the S&P. Notice the 30 week moving average continues to slope down.


Saturday, July 30, 2022

Stock Market Update - July 29, 2022

This week ended with a glimmer of hope as the market bounced up a little bit. From a stage analysis perspective, we are still in stage 4 because the major indexes are still below their 30 week moving average and all the other indicators are also in the red.

Notable news include:


If we have another couple of good weeks, we may see the major indexes above their moving average...