Saturday, January 29, 2022

Stock Market Update - January 28, 2022

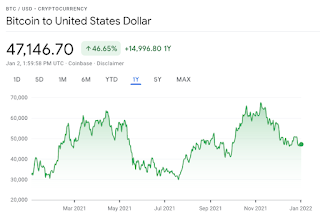
 We are in a bit of a correction. The NasDaq is now in Stage 4 decline because its 30 week moving average line is now sloping downward.


The other major indexes are in Stage 3 and possibly heading for Stage 4.

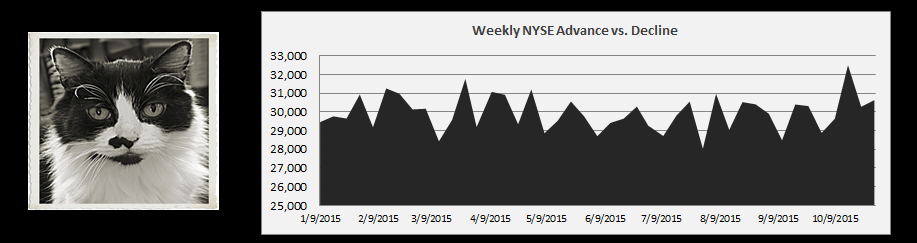
One of my favorite Stan Weinstein indicators is to chart the difference between NYSE stocks hitting their 52 week high vs those hitting their 52 week low. He said not to use it alone but in conjunction with the other indicators. If we take a look at it now, it shows that we are in the beginning of a correction. How far it goes is hard to say, this could be a normal correction or if tensions continue with Russia, inflation doesn't budge and if there are more restrictions due to COVID which is also driving inflation, then it could continue. Hard to say. 


Sunday, January 23, 2022

Stock Market Update - January 21, 2022 - Signals Down

 From my perspective, we are now entering into Stage 3 for the major indexes, all of which are now below their 30 week moving averages. At this point, the moving average line is slightly up or flat, it is not going down into Stage 4. Interestingly, the global Dow is above. Generally it lags the US markets but not this time.


  • Broad indexes except GDOW are below their 30 week moving averages 
  • DJIA vs NYSE A-D: Both Down
  • Divergence: DJIA vs NYSE High/Low: Both Down
  • 200 Day MA NYSE A-D: Below the line for the first time in a long time
  • NYSE  52 Wk Highs-Lows Diff: -519 meaning more stocks were at their lows

Tech took the biggest hit this week.


Sunday, January 16, 2022

Stock Market Update - January 14, 2022

 My indicators are mixed this week. Nothing too horrible, mostly minor showing of weakness in some indicators. The NASDAQ is below its 30 week moving average just a little bit, the NYSE had more lows than highs, and the NYSE/DJIA were both down.

One of my favorite charts, the Dow vs GLD, shows the Dow outperforming gold. I view this as a good sign.


Have you tried to buy a car lately? Used or new they are hard to come by. Dealer lots are empty. So empty in fact that they have used vehicles in the show room and dissuade you from buying used (where they usually make a nice profit) for fear they won't have any example of the model to show potential buyers. Wow.

What's the problem? A chip shortage. The US is looking to boost more manufacturing here.

How about groceries? Tried to buy any of those lately? Around here the veggies shelves are empty. My plan? Go to the local farmer's market. A good idea anyway. Lots of fresh veggies and not pesticides to boot!


Sunday, January 2, 2022

2021 Stock Market Year End Performance

 2021 was a good year for the market! In general up 20%. Not bad. Who would have thought a pandemic would be good for the stock market?

Here's how the major indexes performed:

  • S&P 26.9%
  • NasDaq 21.39%
  • DOW 18.73%
  • GLD -6.24%
  • XLE (Energy ETF) 17.54%
  • TIP (Treasury Inflation Protected Bonds) 1.10%
  • Bitcoin 46.65%

A few visuals to show the year.

S&P 


NASDAQ


DOW


BitCoin to US Dollar


Sunday, December 26, 2021

Stock Market Update - December 24, 2021

 The stage indicators this week turned green. Santa Clause rallied to bring them up.

Tech via the NasDaq took a bit of a hit in the last couple of weeks, but the 30 week moving average is still sloping upward which keeps us in stage 2.


If we look at gold versus the S&P we see gold is below the S&P. I read that as a positive indicator.


Merry Christmas!


Sunday, December 12, 2021

Stock Market Update - December 10, 2021 - Bounce

Stocks bounced back this week with the major indexes bouncing back above their 30 week moving averages. Last week I thought we might be heading into stage 3 but not so fast!

Even Indicator 5 - NYSE Advance-Decline 200 Day Moving Average bounced up.


CNN's Fear and Greed improved slightly this week as well.


On the other hand, it would appear we are now back to wearing masks. At least in New York. Starts on Monday.

My friend J.A. provided a nice link to an article by Jill Mislinski on Advisor Perspectives, that takes moving average analysis to a macro view of 10 months vs what we use here which is 30 week. It's a good read and I plan to add it to my monthly review.

Monday, December 6, 2021

It appears we may be headed for a correction. All of the indicators are red or about to turn red.

Let's look at the indicators.

  1. DJIA vs 30 week MA: Below
  2. S&P  vs 30 week MA:Touching
  3. Nasdaq vs 30 week MA:Touching
  4. Global DOW vs 30 week MA: Below
  5. DJIA vs NYSE A-D: Both Down
  6. Divergence: DJIA vs NYSE High/Low: Both Down
  7. 200 Day MA NYSE A-D:Touching
  8. NYSE  52 Wk Highs-Lows Diff: -182