The market continues to be in an upward trend. The Dow comparison to the NYSE has been flip-flopping between green and red, but the variations are so small I would say it is flat. No real catalysts at the moment.
Header Image

I read the tape, not the news!
Saturday, August 5, 2017
Monday, July 24, 2017
Weekly Stock Market Update: Indicators are Green
The indicators are green this week as the market keeps its upward climb. CNN's Fear and Greed Index is back in the greed area. Frothy is back.
The McClellan Report has an interesting article on this presidential cycle vs. the "normal" cycle.
The McClellan Report has an interesting article on this presidential cycle vs. the "normal" cycle.
Sunday, July 9, 2017
Weekly Stock Market Update: Bubbly anyone?
Markets continue their steady, some would say complacent, upward climb. Two indicators showed some flashes of red. The Dow vs. NYSE High-Low Advance-Decline stats, but not dramatically. There have been some interesting discussions about a possible ETF bubble in the works. It seems more and more people are investing in ETF's rather than individual stocks and more and more new ETFs are being issued.
Weekend Reading List:
Follow your rules, checklists and trend. So far the trend is intact.
Weekend Reading List:
- The Felder Report has a nice article and podcasts covering the topic.
- Financial Times - Record Breaking 2017 for ETFs Fuels fears of stock market bubble
- Bloomberg - Bizzaro World
Follow your rules, checklists and trend. So far the trend is intact.
Sunday, July 2, 2017
Weekly Stock Market Update: All indicators are green
The trend continues to be up. All indicators are back in the green.
I have been itching to sell some of my stock, but will stick to the plan. Investing without a plan is a bad idea because emotions are not logical and you can end up leaving money on the table if you listen to your emotional brain instead of the logical brain that built the plan!
Yahoo Finance has a very interesting interview with MIT scientists Andrew McAfee and Erik Brynjolfsson on their Yahoo! Presents Finance podcast.
Erik also has a popular TED talk on the topic, The Key to Growth? Race with the machines
Strategies to survive? Creativity and emotional intelligence. Interesting ideas. I think it's hard to predict the future. Always keep learning!
Monday, June 19, 2017
Weekly Market Update: Sideways
The market ended mixed last week. Three indicators are in the red with the Dow performing better than the NYSE. That is a defensive sign as the DOW is blue chips with stability. It's possible we are going to move sideways for a little while.
Some interesting reading:
Some interesting reading:
- DecisionPoint Weekly Wrap
- Dr. Wish is looking to see what happens with QQQ this week. Will the uptrend continue or will it break down?
- Fear and Greed index is at neutral
- Investor's Business Daily (IBD) - a look at the week to come and stories on Amazon's purchase of Whole Foods and the DOW moving up.
Let's see what the charts tell us this week.
Monday, June 12, 2017
Weekly Market Update - Tech Stocks Pull Back
This week we saw the NasDaq pull back. Two of the indicators went red:
Dr. Wish has a nice post about the pull back. Bloody Fridays often lead to Bloody Monday Opens.
Let's see what happens today. Honestly, we are due for some sort of pull-back. That's why I like protective stop losses and calculating risk prior to entering into a position.
- NYSE AD vs NYSE 52 HL Differential
- Divergence: DJIA vs NYSE A-D
Let's see what happens today. Honestly, we are due for some sort of pull-back. That's why I like protective stop losses and calculating risk prior to entering into a position.
Sunday, June 4, 2017
Weekly Stock Market Update: Full Steam Ahead
Stocks continue to advance and all indicators are green, with the exception of the dividend ratio on the Dow, but I think that indicator may need adjusting for the era we are in with low interest rates.
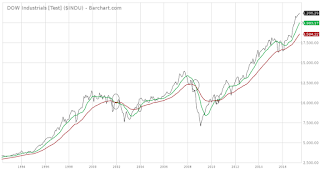
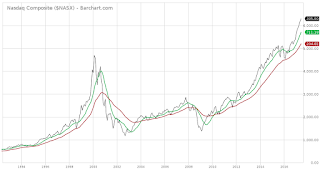
If we take a step back and look at the markets from a macro view and use the 10 month moving average (MA) compared to the 30 month exponential moving average (EMA) on each of the major indexes, we can see a nice picture of where we are. When the 30 EMA crosses over the 10 MA it is bad news, however it the shorter term MA is above the longer EMA, then it is good news. You can see we've been in good news territory for awhile.
This can be a great tool to signal when to get out and when to get back in. Look at the circled cross overs in the chart of the DOW.


From an emotional perspective, it feels like we are in overbought territory, but until the indicators change, I am in.
Subscribe to:
Posts (Atom)