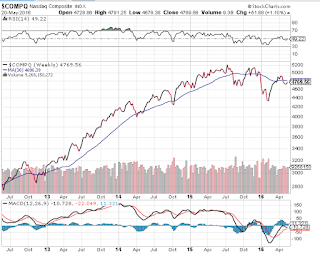
I am on the sidelines for now. We now have more indicators in the red and the major indexes are moving down instead of up. Take a look at these 4 year charts.
Weekly stock market analysis based on Stan Weinstein's stage analysis principles. Bull and Bear Market readings, Buy and Sell checklists, Dow, S&P, Nasdaq, GDOW, NYSE, NYSE A-D, NYSE 52 week highs and lows.
Header Image

I read the tape, not the news!
Saturday, May 21, 2016
Sunday, May 15, 2016
Weekly Market Update: Appears to be heading down
This week's indicators match last week's however, the major indexes are all heading down towards their 30 week moving average. The NASDAQ is already down and the Global Dow is now touching the line. This is not positive news and may signal an upcoming downturn.
Saturday, May 7, 2016
Weekly Market Update: Churning
We remain in a cautionary state with the same number of indicators red and green, but it is important to note that the NasDaq is under its 30 week moving average line. On the other hand, the number of new highs vs new lows continue to be positive. The direction of the market remains in meh-ville.

Saturday, April 30, 2016
Weekly Market Update: Some Indicators are Down
There was some turbulence this week as earnings season is underway. Apple took a beating, as did some other technology stocks, which brought the NasDaq below its 30 week moving average. There were some bright spots in tech, Amazon and Facebook both reported great earnings. We will see how the rest of earnings go this quarter.

Saturday, April 23, 2016
Weekly Market Update: Looking Good
The market held steady last week. The indicators remain positive.

Saturday, April 16, 2016
Weekly Market Update: Sunny Weather
The market is looking pretty good! Even the global Dow is participating in the good performance. Here is a summary of the indicators.

Saturday, April 9, 2016
Weekly Market Update: Signs of Slippage
Some of the indicators that popped up last week are back down this week signaling a possibility we might head back down into a bear market again. The Global Dow is back underneath its 30 week moving average and the NASDAQ is threatening to join it. Both NYSE DOW divergence indicators are down this week as well.
Remember to use stop-loss orders if you had bought any stocks in the last couple of weeks to protect your gains.

Remember to use stop-loss orders if you had bought any stocks in the last couple of weeks to protect your gains.
Subscribe to:
Comments (Atom)


