Market indicators are mixed. The recent upturn appears to be on shaky ground with Nassim Taleb calling for hedging a long tail.
With that in mind, let's see where gold is from a stage perspective using the GLD ETF via stockcharts.
The moving average is sloping up, the close is above the 30 week moving average and fundamentals for gold are improving if you consider that it is widely viewed as a hedge for the market. The chart below shows the peak of gold during the 2009 market downturn was around $180. Current prices is $162. If we consider 180 to be the ceiling then we may have room for higher prices.
How about looking at the tech sector? The NasDaq continues to be in a stage 2 accumulation phase.
Overall, the market is choppy however, and that indicates we are still in phase 4 overall. The DOW and S&P are not in stage 2 but are still in stage 4.
Weekly stock market analysis based on Stan Weinstein's stage analysis principles. Bull and Bear Market readings, Buy and Sell checklists, Dow, S&P, Nasdaq, GDOW, NYSE, NYSE A-D, NYSE 52 week highs and lows.
Header Image
I read the tape, not the news!
Showing posts with label Technical Indicator. Show all posts
Showing posts with label Technical Indicator. Show all posts
Sunday, June 28, 2020
Saturday, January 4, 2020
2019 was a very good year!
2019 was a great year for the stock market! Up 28%!!
Macrotrends has a fantastic graph showing the S&P performance from 1930.
CNN's Fear and Greed is at an all time high.
It appears we may now be in Stage 2 - Advancing. Here's a recap on stage analysis.
The Dow's 30 week moving average is showing a slight upward slope.
Can it last? That's the big question. There is a lot of Geo-policital activity. Trade wars, Iran, etc. Be careful.
Cheers to 2019 and may 2020 be another great year!
Saturday, May 21, 2016
Weekly Market Update: Trend Down
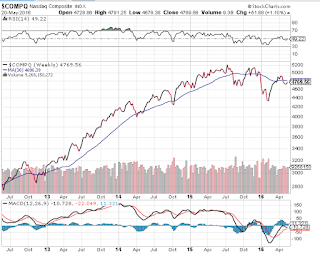
I am on the sidelines for now. We now have more indicators in the red and the major indexes are moving down instead of up. Take a look at these 4 year charts.
Wednesday, February 10, 2016
Technical Indicator: MACD
MACD - Technical Tool
One of the technical indicators covered in Phil Town's Rule #1 book is the MACD. MACD stands for Moving Average Convergence Divergence and is a tool to gauge momentum pressure. It uses 3 EMAs (exponential moving average); slow, fast and a trigger for crossing.Investopedia has a nice explanation here:
Moving average convergence divergence (MACD) is a trend-following momentum indicator that shows the relationship between two moving averages of prices. The MACD is calculated by subtracting the 26-day exponential moving average (EMA) from the 12-day EMA. A nine-day EMA of the MACD, called the "signal line", is then plotted on top of the MACD, functioning as a trigger for buy and sell signals.
Read more: Moving Average Convergence Divergence (MACD) Definition | Investopedia http://www.investopedia.com/terms/m/macd.asp#ixzz3zOt9BgfC
How to use the MACD
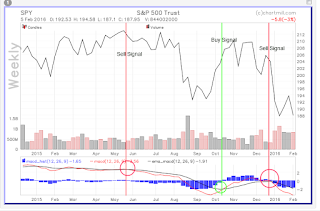
I use the MACD for buy and sell signals, along with my other tools. A buy signal is when the black line crosses above the red line, and likewise, a sell signal is when the red crosses the black line.Let's look at the MACD on the weekly SPY (S&P ETF) using Chartmill. A sell signal was flashed in the May/June 2015 time frame, well before the August sell off. We had a buy signal flash in October of 2015 with a subsequent sell signal returning on January 2016.
As of this writing, the MACD is suggesting we stay out of the SPY. As the SPY can be viewed as a broad market indicator, it can also provide information on the market as a whole.
Tuesday, January 19, 2016
Stage Analysis - Where are we now?
Stan Weintstein's book "Secrets for Profiting in Bull and Bear Markets", relies heavily on Stage Analysis, a method of evaluating a stock and/or an index in terms of accumulation (buying or selling). Using the Stage Analysis model there are four (4) distinct stages every stock and market goes through. I believe we entered Stage 4 in August and remember, I don't buy in Stage 4 because I don't know when it will end.
Stage Analysis:
Stage Analysis:
- Stage 1 - Basing Phase (February 2012)
- 30 week moving average loses its downward slope and starts to improve
- Stage 2 - Advancing Phase (January 2013)
- 30 week moving average slopes up.
- Close is above the 30 week moving average, with higher lows
- Fundamentals improve
- Stage 3 - The Top Phase (May 2015)
- Loses momentum
- Choppy market
- 30 week moving average loses upward slope and flattens
- Stage 4 - Declining Phase (August 2015)
- Close line below Moving average
- 30 week moving average is sloping down
Subscribe to:
Posts (Atom)


