Showing posts with label Stage Analysis. Show all posts

Monday, September 20, 2021

Stock Market Update Week Ending September 17, 2021

The Stage Indicators are beginning to point to weakness in the market with the major indexes about to breach their 30 week moving average line. We are due for a pullback and may see one in the coming weeks.

The FINVIZ.com heatmap from Friday is mostly Red.


Drivers appear to be financially related vs. COVID. China's Evergrande may not be able to pay it's debt, talk of Fed tapering, and debt ceiling debates.


Here is a snapshot of the S&P which appears to be entering into Stage 3.


Hang tight.


Sunday, June 20, 2021

Stock Market Update: June 18, 2021 - Signs of Inflation

 For the first time in a while, markets were down at the end of the week. The worst since February. 

 Contributing factors include expected rate hikes by the Fed.

From a stage analysis view, we are still flying high, but and this is a big but, the 3 major indexes look poised to go below their 30 week moving averages. If this happens we may be entering stage 4.

CNN's Fear and Greed indicator is the lowest it has been in quite some time.


Housing continues to be out of control! Prices are skyrocketing. COVID cases are way down in the USA and there is hope for the future.


Sunday, February 21, 2021

Bitcoin has been making news over the last couple of weeks. A large surge was seen after Elon Musk announced Tesla plans to accept bitcoin. Tesla bought $1.5 billion bitcoin.
 
Then there was the introduction of a new Bitcoin ETF, Purpose BTCC.


 This week also brought an unusual winter storm URI to Texas. Texas is now examining the problems that brought power issues, such as rolling blackouts and lack of water. 
 
It's time to look at energy by viewing the XLE chart. I think it is in Stage 1. The moving average line is starting to slope upward. I expect that when we recover from COVID, energy prices will rebound from the big plunge they took last year.


 For more reading on energy, I recommend these articles on Stockcharts:


Sunday, January 31, 2021

Stock Market Update - January 31, 2021

 Looks like we are finally getting a bit of a correction.

There has been lots of turbulence and excitement over the last couple of weeks related to GameStop and the Robinhood app. (New York Times article) 

Individual investors are still alive and kicking, and reading on reddit apparently. (CNN business article)

Meanwhile, back to stage analysis... while we had the first downturn in a while, the indicators are still green. A pullback will be welcome and logical.


Saturday, November 21, 2020

Stock Market Update: November 20, 2020

The markets are remaining positive and gold is showing signs of moving into stage 3. The moving average line is still on an uptrend however the weekly end is sloping down. This week brought news of multiple COVID-19 vaccines and some hope. Both
Pfizer/BioNTech and Moderna announced positive results.


Bitcoin is seeing new highs.


Stay frosty!

Sunday, October 25, 2020

Stock Market Update - October 23, 2020

Not much change in the stock market. It continues to hold steady. The Moving Average line on the global DOW is not slanting upward which is a positive sign.

With the election a couple of weeks away, Stock Chart's Three Takes on the Presidential Cycle article by David Keller is timely. Stan talks about presidential cycles in his book and I think Tom McClellan pretty much presents a similar viewpoint.

It's been awhile since we've looked at COVID-19. I am hoping the two charts below from the CDC provide some glimmer of hope. Cases are going up, but deaths are not.

 Total Cases


Total Deaths


Sunday, September 27, 2020

Stock Market Update: September 25, 2020

There is a lot of uncertainty in the air. We have the upcoming election, talks of fast tracking a COVID-19 vaccine, and in general malaise and people are sick and tired of the lock down. 

The major indexes are above their 30 week moving averages however they are not looking to be in good shape as evidenced by the S&P chart below.


Gold appears to be consolidating. Its moving average line is still sloping up however which is a positive indicator.

I am in a wait and see mode at the moment and expect some turbulence with the election.

Monday, August 31, 2020

Stock Market Update: End of August 2020

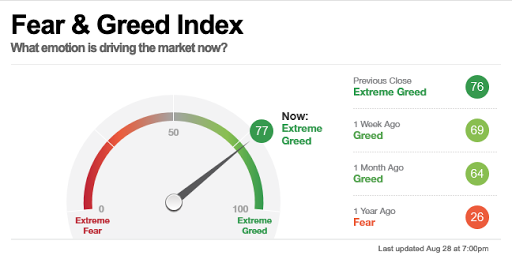
 The market continues to move up. CNN's Fear and Greed indicator is reading greed.


I find this chart I came up with to be interesting. The Gold ETF, GLD, compared to the DOW price action. If you notice, gold went up prior to the big market decline in 2009.  I circled the cross overs however you can see the price action diverged between the two when there was a change in the market. At the moment both are on an uptrend. In my opinion, if a COVID-19 vaccine comes out, then gold will probably drop, at least temporarily. It could continue to hold steady though as governments around the world print money and the dollar keeps losing value.


Sunday, August 16, 2020

Stock Market Update: Week Ending August 14, 2020

 From a stage analysis view, markets are in mixed territory. I rate 4 of the indicators as neutral. The DOW, global DOW and S&P are above their 30 week moving average line, but the MA is sloping down or flat. Not exactly a sign of strength.

One of my favorite Stan Weinstein charts is the NYSE High Low Differential which looks at the difference between the number of stocks hitting their 52 week highs and 52 week lows.  Each week I look at the number of new 52 week highs and the number of new 52 week lows. For example, this week we had 44 stock reaching new highs and 7 stocks reaching new lows. Not much action at all. In a strong recovery the numbers are more like 389 to 30 respectively. So while this indicator is in the green, it's not by much and the highs versus lows is not that broad.

Here is my chart. I have found that this one chart can give a pretty decent indicator of the overall market, even though it's a very simple chart.


Also keep in mind we are heading into an election plus COVID is not over yet so the market can get pretty choppy yet.


Sunday, July 19, 2020

Stock Market Update: July 17, 2020 - Let's Look at Gold

Stocks are doing well from a Stage Analysis view, with the DOW joining the other major indexes when it finally move above its 30 week moving average. Let's see if it sticks.

Gold has been getting a lot of attention lately as it reaches highs lately and the US government printing money like crazy. See this interesting Barron's Article.

I thought it would be interesting to compare gold to the DOW and S&P. If the recent crossover is any indication and works like it did in the 2009 downturn, gold may continue to move upwards. The orange line in each chart represents GLD (ETF).


How about technology? It also is on an upward trend. Martin Pring has a great blog post on it. The next coming week's will help us see if the trend will continue or reverse.


Sunday, June 28, 2020

Stock Market Update: June 28, 2020

Market indicators are mixed. The recent upturn appears to be on shaky ground with Nassim Taleb calling for hedging a long tail. 

With that in mind, let's see where gold is from a stage perspective using the GLD ETF via stockcharts.

The moving average is sloping up, the close is above the 30 week moving average and fundamentals for gold are improving if you consider that it is widely viewed as a hedge for the market. The chart below shows the peak of gold during the 2009 market downturn was around $180. Current prices is $162. If we consider 180 to be the ceiling then we may have room for higher prices.


How about looking at the tech sector? The NasDaq continues to be in a stage 2 accumulation phase.


Overall, the market is choppy however, and that indicates we are still in phase 4 overall. The DOW and S&P are not in stage 2 but are still in stage 4.
 

Sunday, June 7, 2020

Stock Market Update: Week Ending June 5, 2020

Big rebound in markets this week with an upbeat jobs report.

From a stage analysis perspective, we have the following:
  • DOW & S&P : Stage 4. The 30 week moving average is still sloping down or is flat.
  • NASDAQ: Stage 1: Closing price above the 30 week moving average and the moving average is sloping upward
 The CNN Fear and Greed index is showing a little bit of improvement the first time a long time.


Many areas in the US are re-opening in phases and fingers crossed, we can re-open without a resurgence in cases. We all need to get out of the house!!  
 

Monday, May 25, 2020

Stock Market Update: Week Ending May 22, 2020

Markets are mixed. There are signs of hope as states start to reopen. The Wall Street Journal has a nice map.


Many are limiting gatherings to 10 people or less. It would be nice to see a little more flexibility in some of the restrictions. If a wine store can be an 'essential' business and allow foot traffic, then you would think some additional retail stores could also be open with managed foot traffic. We want our small businesses to stay open and functioning, they are the backbone of our towns.


The NASDAG continues to be in a Stage 1 uptrend, while the S&P and DOW remain in Stage 4 decline. GLD appears to be strongly in Phase 2.


Sunday, May 17, 2020

Stock Market Update - Week Ending May 15, 2020

From a stage analysis perspective, the market continues to be in Stage 4.
The NASDAQ continues to be in a stage 1, but the other indexes are in stage 4.


The CDC map for the week


Stay at home orders map from Business Insider.


Saturday, April 18, 2020

Stock Market Update: Week of April 16, 2020

Markets rebounded  little bit this week. The NASDAQ tip-toed above it's 30 week moving average, while the others are still beneath their MA line.


CNN's Fear & Greed Index is moving from it's position on the far left towards the center. Another hopeful sign.


COVID continues to spread across the US but some states are starting to recover too.


Many are looking forward to re-opening the country. Optimistically in May.

Saturday, March 28, 2020

Stock Market Update - Week Ending March 27 2020 - COVID 19 update

Here in the US, this week has been bumpy. The government passed a 2$ Trillion dollar stimulus bill on Friday. The economy is taking a big hit with the lockdown of non-essential businesses in many states in an attempt to flatten the infection rate curve. The idea is to slow down the rate of infection to make sure hospitals don't get overwhelmed with cases all at once. Supplies and equipment needed, such as ventilators, must be available to help people with severe impact to their lungs.

The CDC infection rate map is below.


Hopefully, a vaccine will be found, or at least a better treatment for those who get infected.

Remember we are clearly in Stage 4.


Stage 1 - Basing Phase 
  •  30 week moving average loses its downward slope and starts to improve
Stage 2 - Advancing Phase 
  • 30 week moving average slopes up. 
  • Close is above the 30 week moving average, with higher lows
  •  Fundamentals improve
Stage 3 - The Top Phase 
  • Loses momentum
  • Choppy market
  • 30 week moving average loses upward slope and flattens 
Stage 4 - Declining Phase
  •  Close line below Moving average
  •  30 week moving average is sloping down

Be safe.


Sunday, March 8, 2020

Stock Market Update - COVID 19

News this week continues to be on the Coronavirus-2019.

The US impact as of this week is shown below in this chart from the CDC.


Not surprisingly, the CNN Fear and Greed index is set to Extreme Fear.


The S&P is showing Stage 4 signs.


Develop a watch list and know that the broad market will impact all stocks.

Recommendations for the virus are pretty much the same as for the flu. CDC recommendations and hand-washing. Hand sanitizers are for when you don't have access to soap and water.


Sunday, March 1, 2020

February 2020 Stock Market Update

The coronavirus COVID-19, is front and center this month as the stock market reacts to spread of the virus across the globe. Depending on what you read it's either time to panic or everyone is overreacting. The US is starting to see negative impacts and unfortunately some deaths. CNN update.

The CNN Fear and Greed indicator is at the lowest I can remember seeing it.


All of the Stage Analysis Indicators are now in the red. We most likely are entering into stage 4. StockCharts Graph Link.