MACD - Technical Tool
One of the technical indicators covered in Phil Town's Rule #1 book is the MACD. MACD stands for Moving Average Convergence Divergence and is a tool to gauge momentum pressure. It uses 3 EMAs (exponential moving average); slow, fast and a trigger for crossing.Investopedia has a nice explanation here:
Moving average convergence divergence (MACD) is a trend-following momentum indicator that shows the relationship between two moving averages of prices. The MACD is calculated by subtracting the 26-day exponential moving average (EMA) from the 12-day EMA. A nine-day EMA of the MACD, called the "signal line", is then plotted on top of the MACD, functioning as a trigger for buy and sell signals.
How to use the MACD
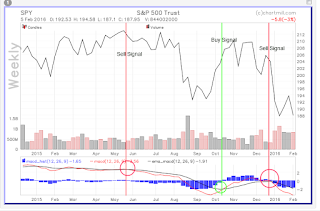
I use the MACD for buy and sell signals, along with my other tools. A buy signal is when the black line crosses above the red line, and likewise, a sell signal is when the red crosses the black line.Let's look at the MACD on the weekly SPY (S&P ETF) using Chartmill. A sell signal was flashed in the May/June 2015 time frame, well before the August sell off. We had a buy signal flash in October of 2015 with a subsequent sell signal returning on January 2016.
As of this writing, the MACD is suggesting we stay out of the SPY. As the SPY can be viewed as a broad market indicator, it can also provide information on the market as a whole.


No comments:
Post a Comment
Note: Only a member of this blog may post a comment.