Showing posts with label gdow. Show all posts

Sunday, March 12, 2023

Stock Market Update - Back in the Negative

This week the DOW moved beneath it's 30 week moving average and the SPY and NASDAQ's 30 meek moving average reversed and is pointing down. Any hopes of moving into Stage 1 is squashed as we are again in Stage 4 decline. See previous post for Stage Analysis.

In addition Indicator 5: NYSE Advance-Decline 200 day moving average is touching the moving average line as shown below in this StockChart's graph.


The only index still positive is the Global DOW.

Some are pointing to the Silicon Valley Bank (SVB) Collapse as the main reason for last week's market downturn. Investors are watching to see if a bailout will take care of investors with deposits above the FDIC’s $250,000 cap. 

Never a dull moment.


Sunday, February 13, 2022

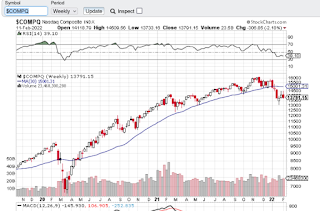
Stock Market Update - Feb 11, 2022 - Bear Market - Stage 4

Looking at the Stan Weinstein indicators, we are in a Bear Market. All indicators except for the Global Dow are negative. 

COVID cases are down and hopefully life returns to normal in 2022. So what is the problem? Inflation, Ukraine/Russia tension according to this Wall Street Journal article.

Tech, led by Facebook is taken a beating. FANG stocks are not looking too good. Apple is doing fine but the others are not.   The Apple vs Facebook battle over our data is an interesting one. 

Let's look at the charts. At this point, just a minor correction. We will have to wait and see if it stays minor or gets larger.


Monday, December 6, 2021

It appears we may be headed for a correction. All of the indicators are red or about to turn red.

Let's look at the indicators.

  1. DJIA vs 30 week MA: Below
  2. S&P  vs 30 week MA:Touching
  3. Nasdaq vs 30 week MA:Touching
  4. Global DOW vs 30 week MA: Below
  5. DJIA vs NYSE A-D: Both Down
  6. Divergence: DJIA vs NYSE High/Low: Both Down
  7. 200 Day MA NYSE A-D:Touching
  8. NYSE  52 Wk Highs-Lows Diff: -182


Saturday, November 27, 2021

Market Update November 26, 2021 - Bumpy COVID Varient in Africa

Friday saw a sell off of about 2% to 2.5% amid concerns of a new COVID varient in South Africa.

Let's look at the indicators.

  1. DJIA vs 30 week MA: Touching the moving average line
  2. S&P  vs 30 week MA: Above
  3. Nasdaq vs 30 week MA: Above
  4. Global DOW vs 30 week MA: Below
  5. DJIA vs NYSE A-D: Both Down
  6. Divergence: DJIA vs NYSE High/Low: Both Down
  7. 200 Day MA NYSE A-D: Above
  8. NYSE  52 Wk Highs-Lows Diff: -182


Interesting articles for further reading:

Sunday, October 25, 2020

Stock Market Update - October 23, 2020

Not much change in the stock market. It continues to hold steady. The Moving Average line on the global DOW is not slanting upward which is a positive sign.

With the election a couple of weeks away, Stock Chart's Three Takes on the Presidential Cycle article by David Keller is timely. Stan talks about presidential cycles in his book and I think Tom McClellan pretty much presents a similar viewpoint.

It's been awhile since we've looked at COVID-19. I am hoping the two charts below from the CDC provide some glimmer of hope. Cases are going up, but deaths are not.

 Total Cases


Total Deaths


Monday, May 28, 2018

Stock Market Update:


The indicators are doing fairly well with the exception of the Global DOW which is below its 30 week moving average. We seem to be churning a bit. Decision Point blog has a nice article on the week.

Oil prices may drop as producers (OPEC, Russia, USA) boost output. Don't expect to see any benefits at the gas station yet though. XLE appears to be in a Stage 2, let's see if it can keep the momentum or if it will be short lived.


An interesting article in the NY Times talking about the continued use of antibiotics in our food system to fatten up livestock. Another good reason to support the local producers at farmer's markets and in grocery stores.

Wednesday, December 30, 2015

Indicator 8: International Markets

When gauging the weekly market breadth, it is important to include a view outside of the United States. The Global Dow is reviewed to see if it is moving in the same direction as the Dow, NYSE, Nasdaq and SPY indexes.  I take a weekly view and see if it is above or below its 30 week moving average, and to see if it is moving in the same direction as the US Markets. As of this post, the Global Dow continues to struggle. It has been below its 30 week moving average for months, and, the moving average line is sloping down. Both are bear signals.


Links: