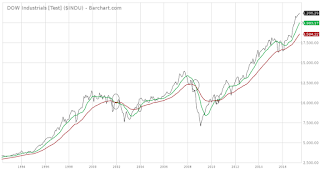
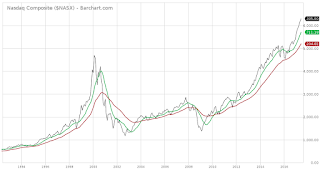
Stocks continue to advance and all indicators are green, with the exception of the dividend ratio on the Dow, but I think that indicator may need adjusting for the era we are in with low interest rates.
If we take a step back and look at the markets from a macro view and use the 10 month moving average (MA) compared to the 30 month exponential moving average (EMA) on each of the major indexes, we can see a nice picture of where we are. When the 30 EMA crosses over the 10 MA it is bad news, however it the shorter term MA is above the longer EMA, then it is good news. You can see we've been in good news territory for awhile.
This can be a great tool to signal when to get out and when to get back in. Look at the circled cross overs in the chart of the DOW.
From an emotional perspective, it feels like we are in overbought territory, but until the indicators change, I am in.


