We are looking for signs of an early stage 1 or stage 2 advance. At the moment we are in a trading range and if the indexes can rise above the overhead resistance we will see a positive sign.
Weekly stock market analysis based on Stan Weinstein's stage analysis principles. Bull and Bear Market readings, Buy and Sell checklists, Dow, S&P, Nasdaq, GDOW, NYSE, NYSE A-D, NYSE 52 week highs and lows.
Header Image

I read the tape, not the news!
Sunday, July 3, 2016
Weekly Market Update: Back in the Green
The market made a nice comeback this week and all the indicators are in the green.
We are looking for signs of an early stage 1 or stage 2 advance. At the moment we are in a trading range and if the indexes can rise above the overhead resistance we will see a positive sign.

We are looking for signs of an early stage 1 or stage 2 advance. At the moment we are in a trading range and if the indexes can rise above the overhead resistance we will see a positive sign.
Saturday, June 25, 2016
Weekly Market Update: Brexit brings GDOW Below its 30 Week Moving Average
The market was down this week largely due to the BREXIT vote. Britain voted to leave the EU. The indicators are 50/50. There were still more new highs than lows, which I find interesting.

Another interesting item is that the DOW declined but the NYSE A-D went up. Also a positive indicator. (Barron's Data Here)

I will want to see what transpires next week, but think this could potentially be a buying opportunity. We'll see.
Another interesting item is that the DOW declined but the NYSE A-D went up. Also a positive indicator. (Barron's Data Here)
I will want to see what transpires next week, but think this could potentially be a buying opportunity. We'll see.
Friday, June 24, 2016
News: Britain votes to leave the European Union
Futures are down this morning as news of the UK vote is soaked in. We are in for a wild ride as market sort through the impact of the vote. Mr. Market likes predictability and this is anything but!
U.S. Stocks: Dow futures down 500 points pre-market
This may bring us some buying opportunities, but wait until the dust settles.
Cheers.
U.S. Stocks: Dow futures down 500 points pre-market
This may bring us some buying opportunities, but wait until the dust settles.
Cheers.
Sunday, June 19, 2016
Weekly Market Update: So-So
The market continues to be in a trough. This week three indicators are flashing red. The Dow vs. NYSE AD and the Dow vs NYSE High-Low. Both are down. We still look for clear direction.

Saturday, June 11, 2016
Weekly Market Update: What stage are we in?
While the indicators are fairly positive, I remain cautious. The market doesn't feel like it has conviction. Here are this week's indicators.
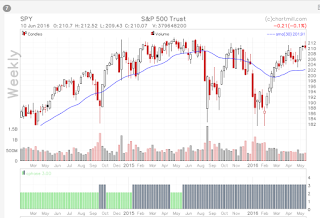
For Weinstein fan's Chartmill has some fantastic indicators available on its charting site. Here is a graph I put together using their tool. It shows SPY on a weekly basis with a 30 week moving average, Stage Indicators and the Weinstein RSI. We are still in Stage 1.
I am looking for the early start of Stage 2 for an entry point.
Of interest, the Dow dividend ETF is in a Stage 2 Advance indicated by the green, while the S&P ETF (SPY) and Nasdaq ETF (QQQ) are in Stage 3, indicated by the grey bars. Remember the Dow is defensive.
For information on Chartmill's Stan Weinstein indicators click here.
Monday, June 6, 2016
Weekly Market Update: Symbols are Up
Chartmill posted a very good article in the blog this weekend stating the market has been in a channel since April. "Since April, the Dow has been content to drift aimlessly between 17,500 and 18,000. Similarly, the S&P 500
is vacillating between roughly 2050 and 2100. Weekly volume for both
indexes declined significantly over the month of May. ...this is not a good environment for trend-followers
and you need to be wary of signals from trend-based approaches right
now."
This matches what I've seen with the symbols. They are up then down, then sideways. No real direction has emerged. This week we are up but I don't necessarily trust it.

This matches what I've seen with the symbols. They are up then down, then sideways. No real direction has emerged. This week we are up but I don't necessarily trust it.
Monday, May 30, 2016
Weekly Market Update: Improvement
This market is choppy and doesn't seem to have a sense of direction. It might stay this way until we have the elections. This week we are back in positive territory.

Subscribe to:
Posts (Atom)


